For the 5th year, we’ve studied the behaviors of U.S. consumers. Our latest survey provides in-depth reporting into demographics, preferences, shopping trends, and much more.
From “big box” and convenience stores, to department and grocery stores, you’ll get insight into the wants, needs, and habits of your customer base.
For our 2020 Consumer Study, we asked and your customers answered. Find out what they had to say about:
- Online shopping and in-store pickup trends
- App use and subscription services
- In-store shopping experiences and influencers
- Decision-making factors
- And more!
Introduction
Retail design firm King Retail
Solutions (“KRS”) has revived its
annual study to better understand
US consumer behaviors and
preferences. This report is now in
its 5th year of release and focuses
on category blurring across retail
channels along with the ways those
purchases are being made.
Throughout this report, KRS
compares how our shopping habits
have changed and evolved over the
last 5 years.
Retail design firm King Retail Solutions (“KRS”) has revived its annual study to better understand US consumer behaviors and preferences. This report is now in its 5th year of release and focuses on category blurring across retail channels along with the ways those purchases are being made. Throughout this report, KRS compares how our shopping habits have changed and evolved over the last 5 years.

How We Shop Online
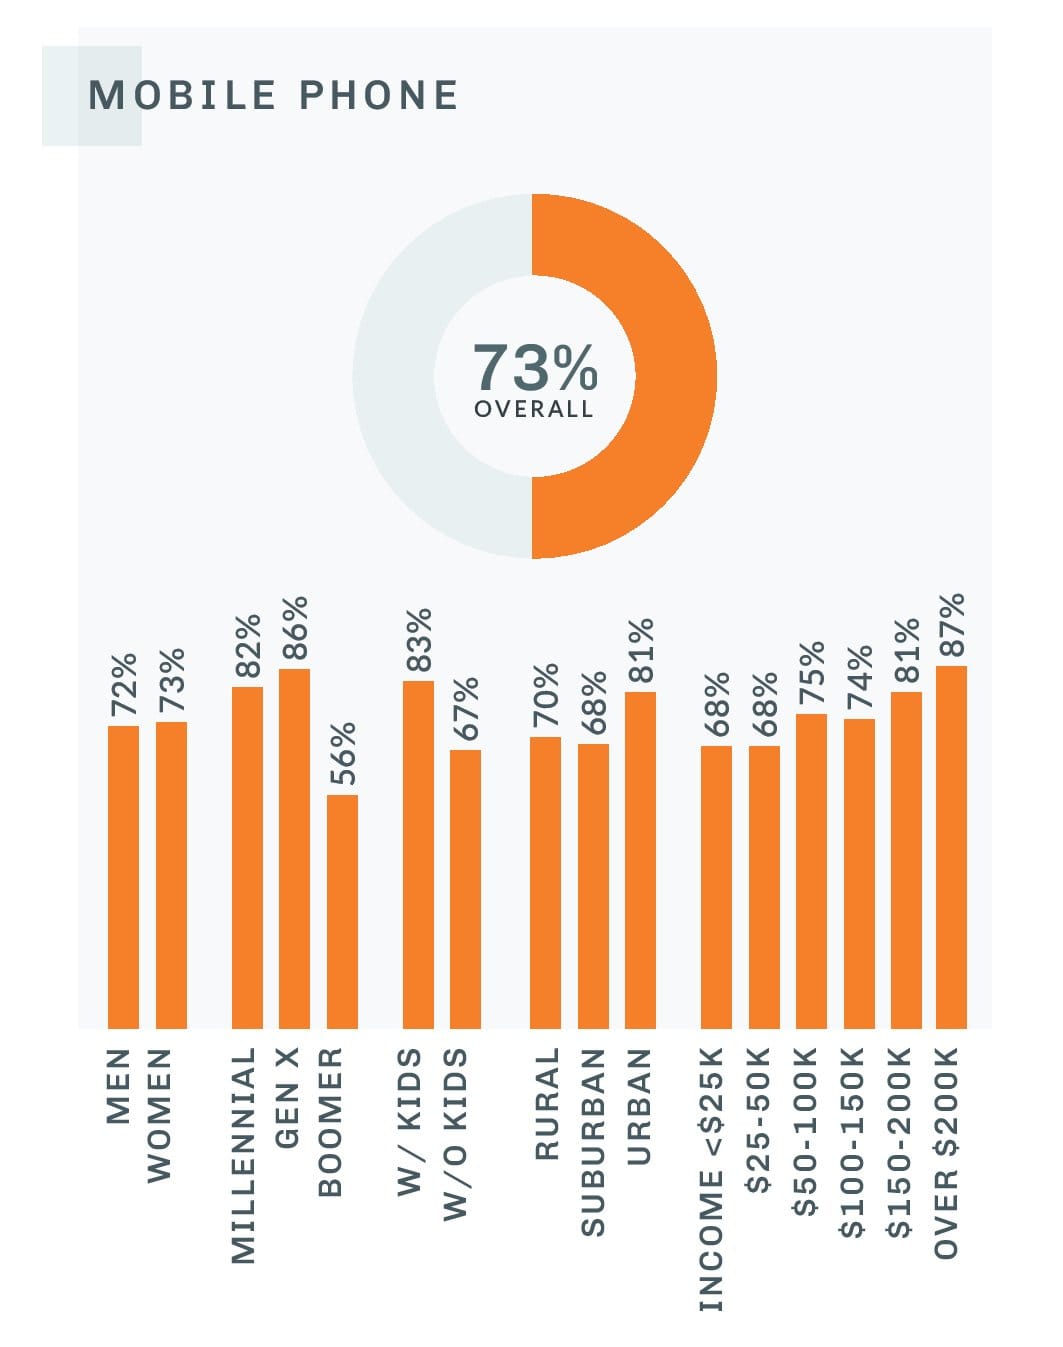
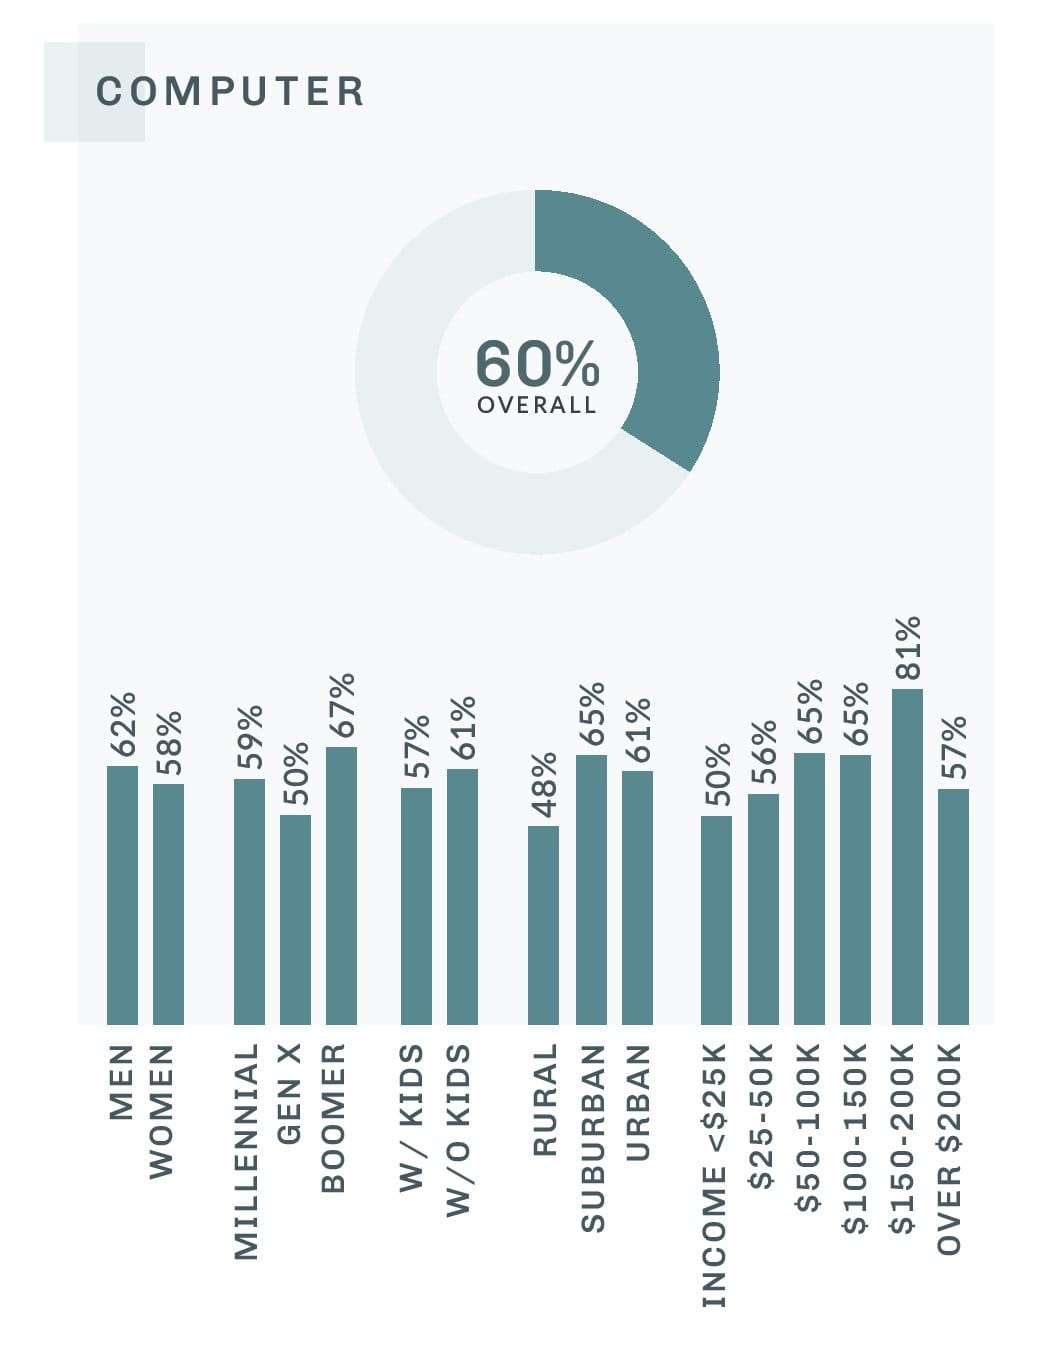
The exceptions to this are Boomers, who still prefer shopping on the computer over other devices, and consumers with annual incomes between $150k and $200k, who use mobile phones and computers equally.
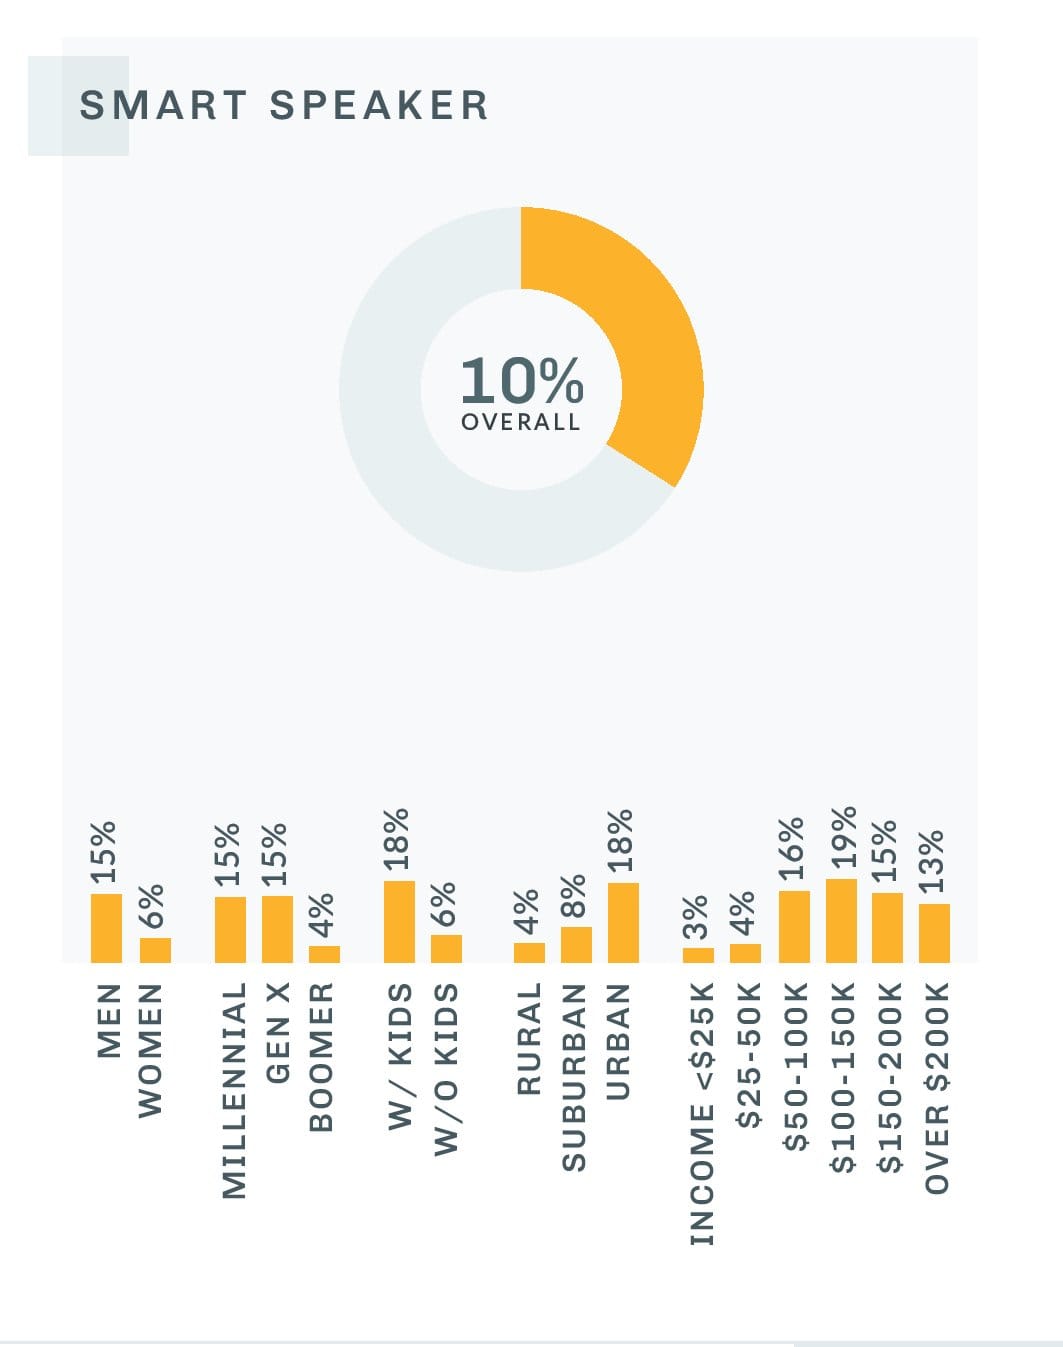
One relatively new trend to keep an eye on is the rise of the smart speaker. While it currently lags far behind the other options as of this survey, it will be interesting to see what the next few years show regarding smart speakers as an industry disruption.
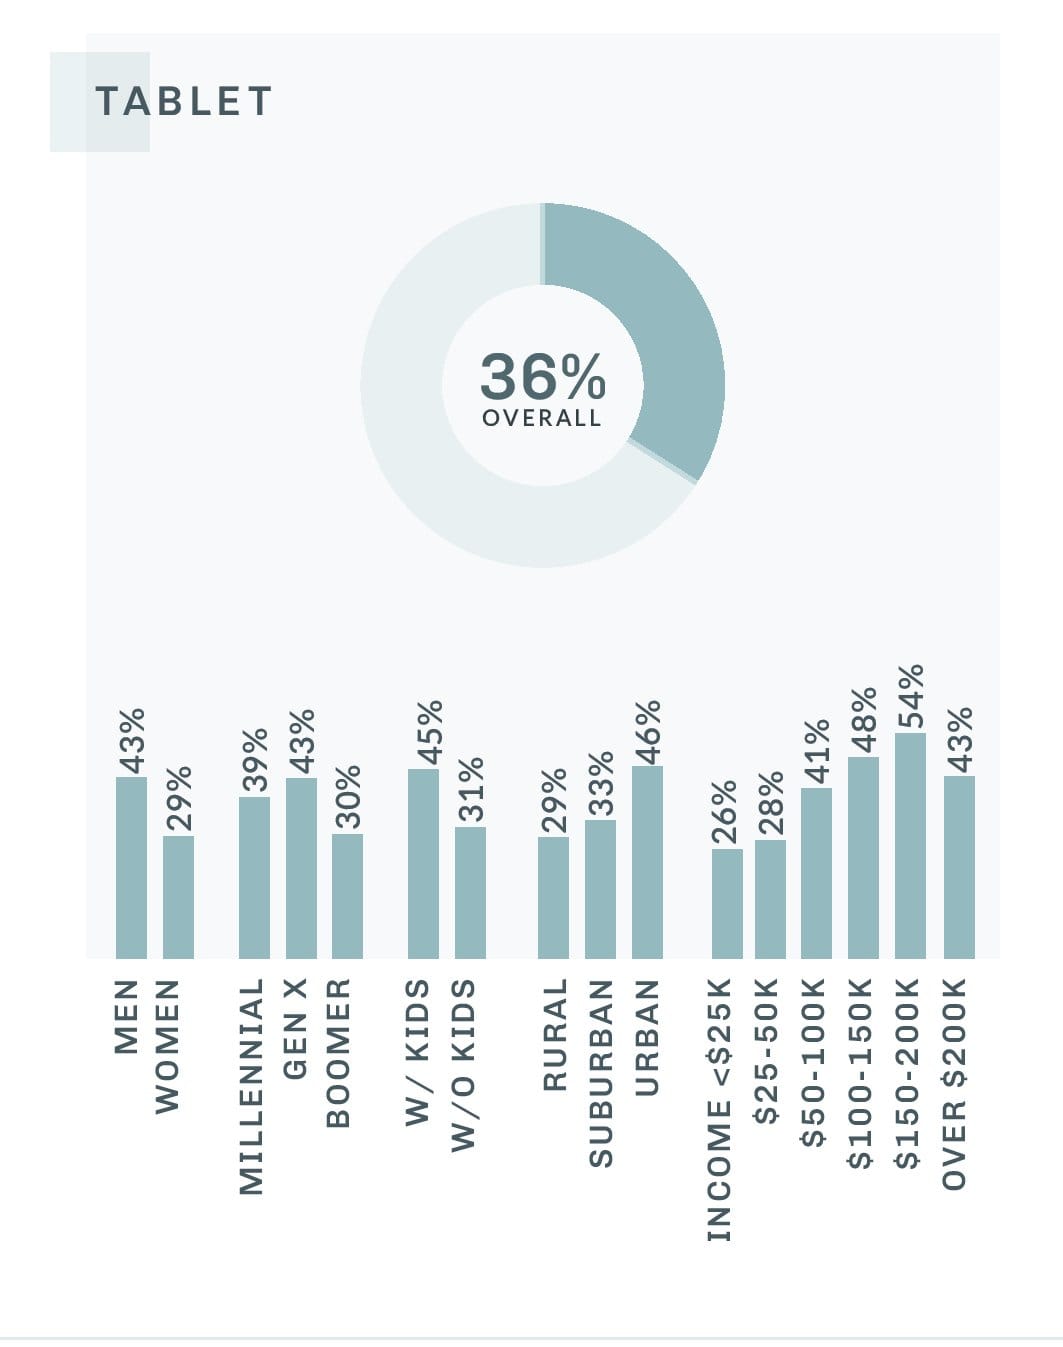
Which of the following devices do you use to make online purchases?
How many shopping-related apps (including food delivery services) do you currently have installed on your smartphone or mobile device?
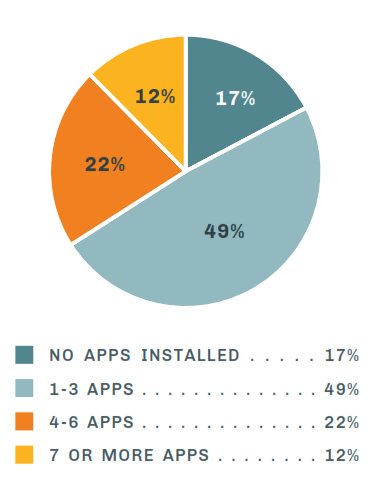
The greatest difference amongst the various demographics is based on income.
Of consumers making less than $25k a year, 30% have zero shopping related apps installed.
For those making over $200K per year, only 4% have zero shopping apps
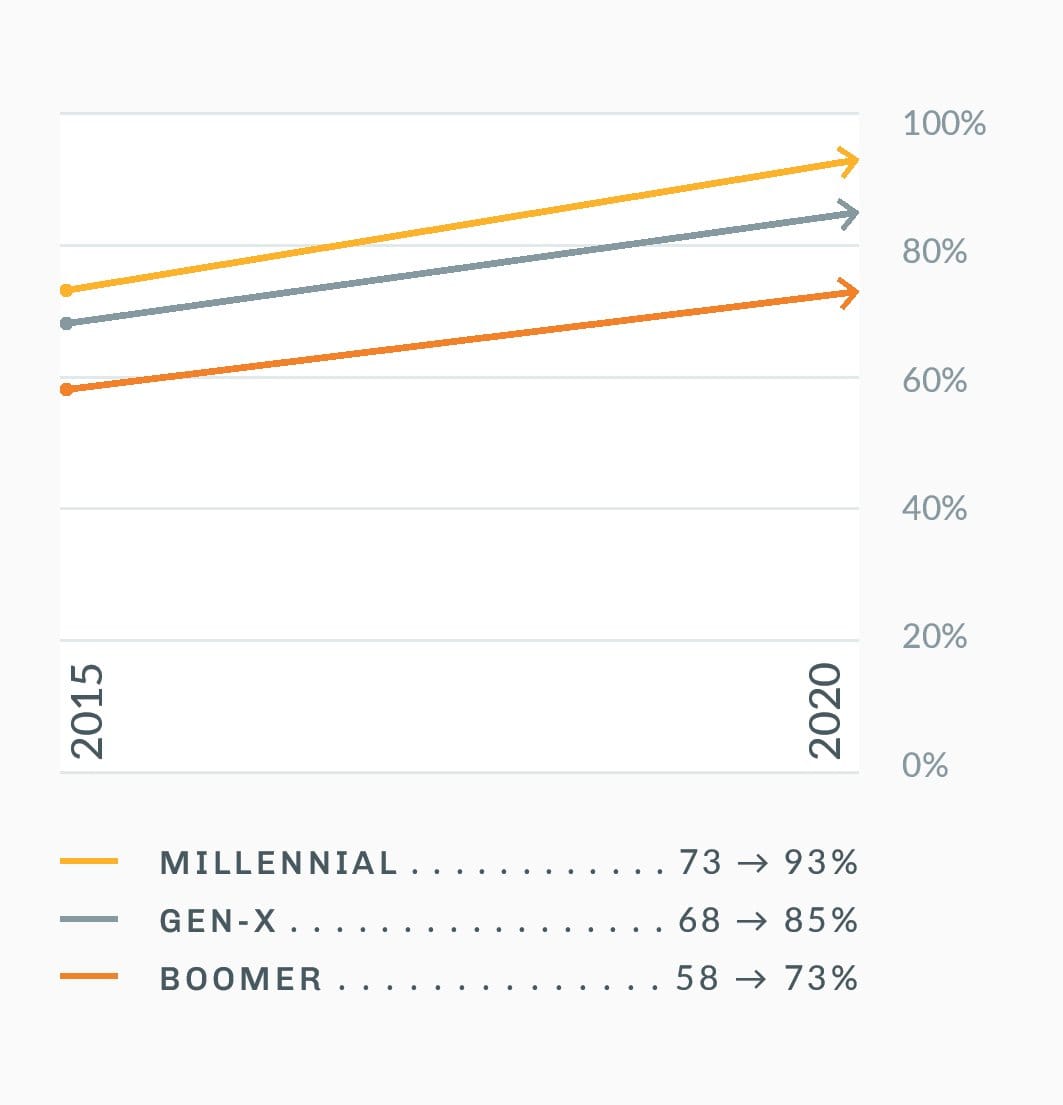
RESPONDENTS WITH AT LEAST ONE SHOPPING APP, FROM 2015 TO 2020:
In 2015, 67% of the respondents had at least one shopping-related app on their smartphone.
Five years later, 83% of respondents have at least one shopping-related app on their phone.
While growth across genders and generations has seen double-digit increases, Millenials continue to embrace app-centric shopping the most, with 93% having at least one shopping app installed.

Online & In Store Crossovers
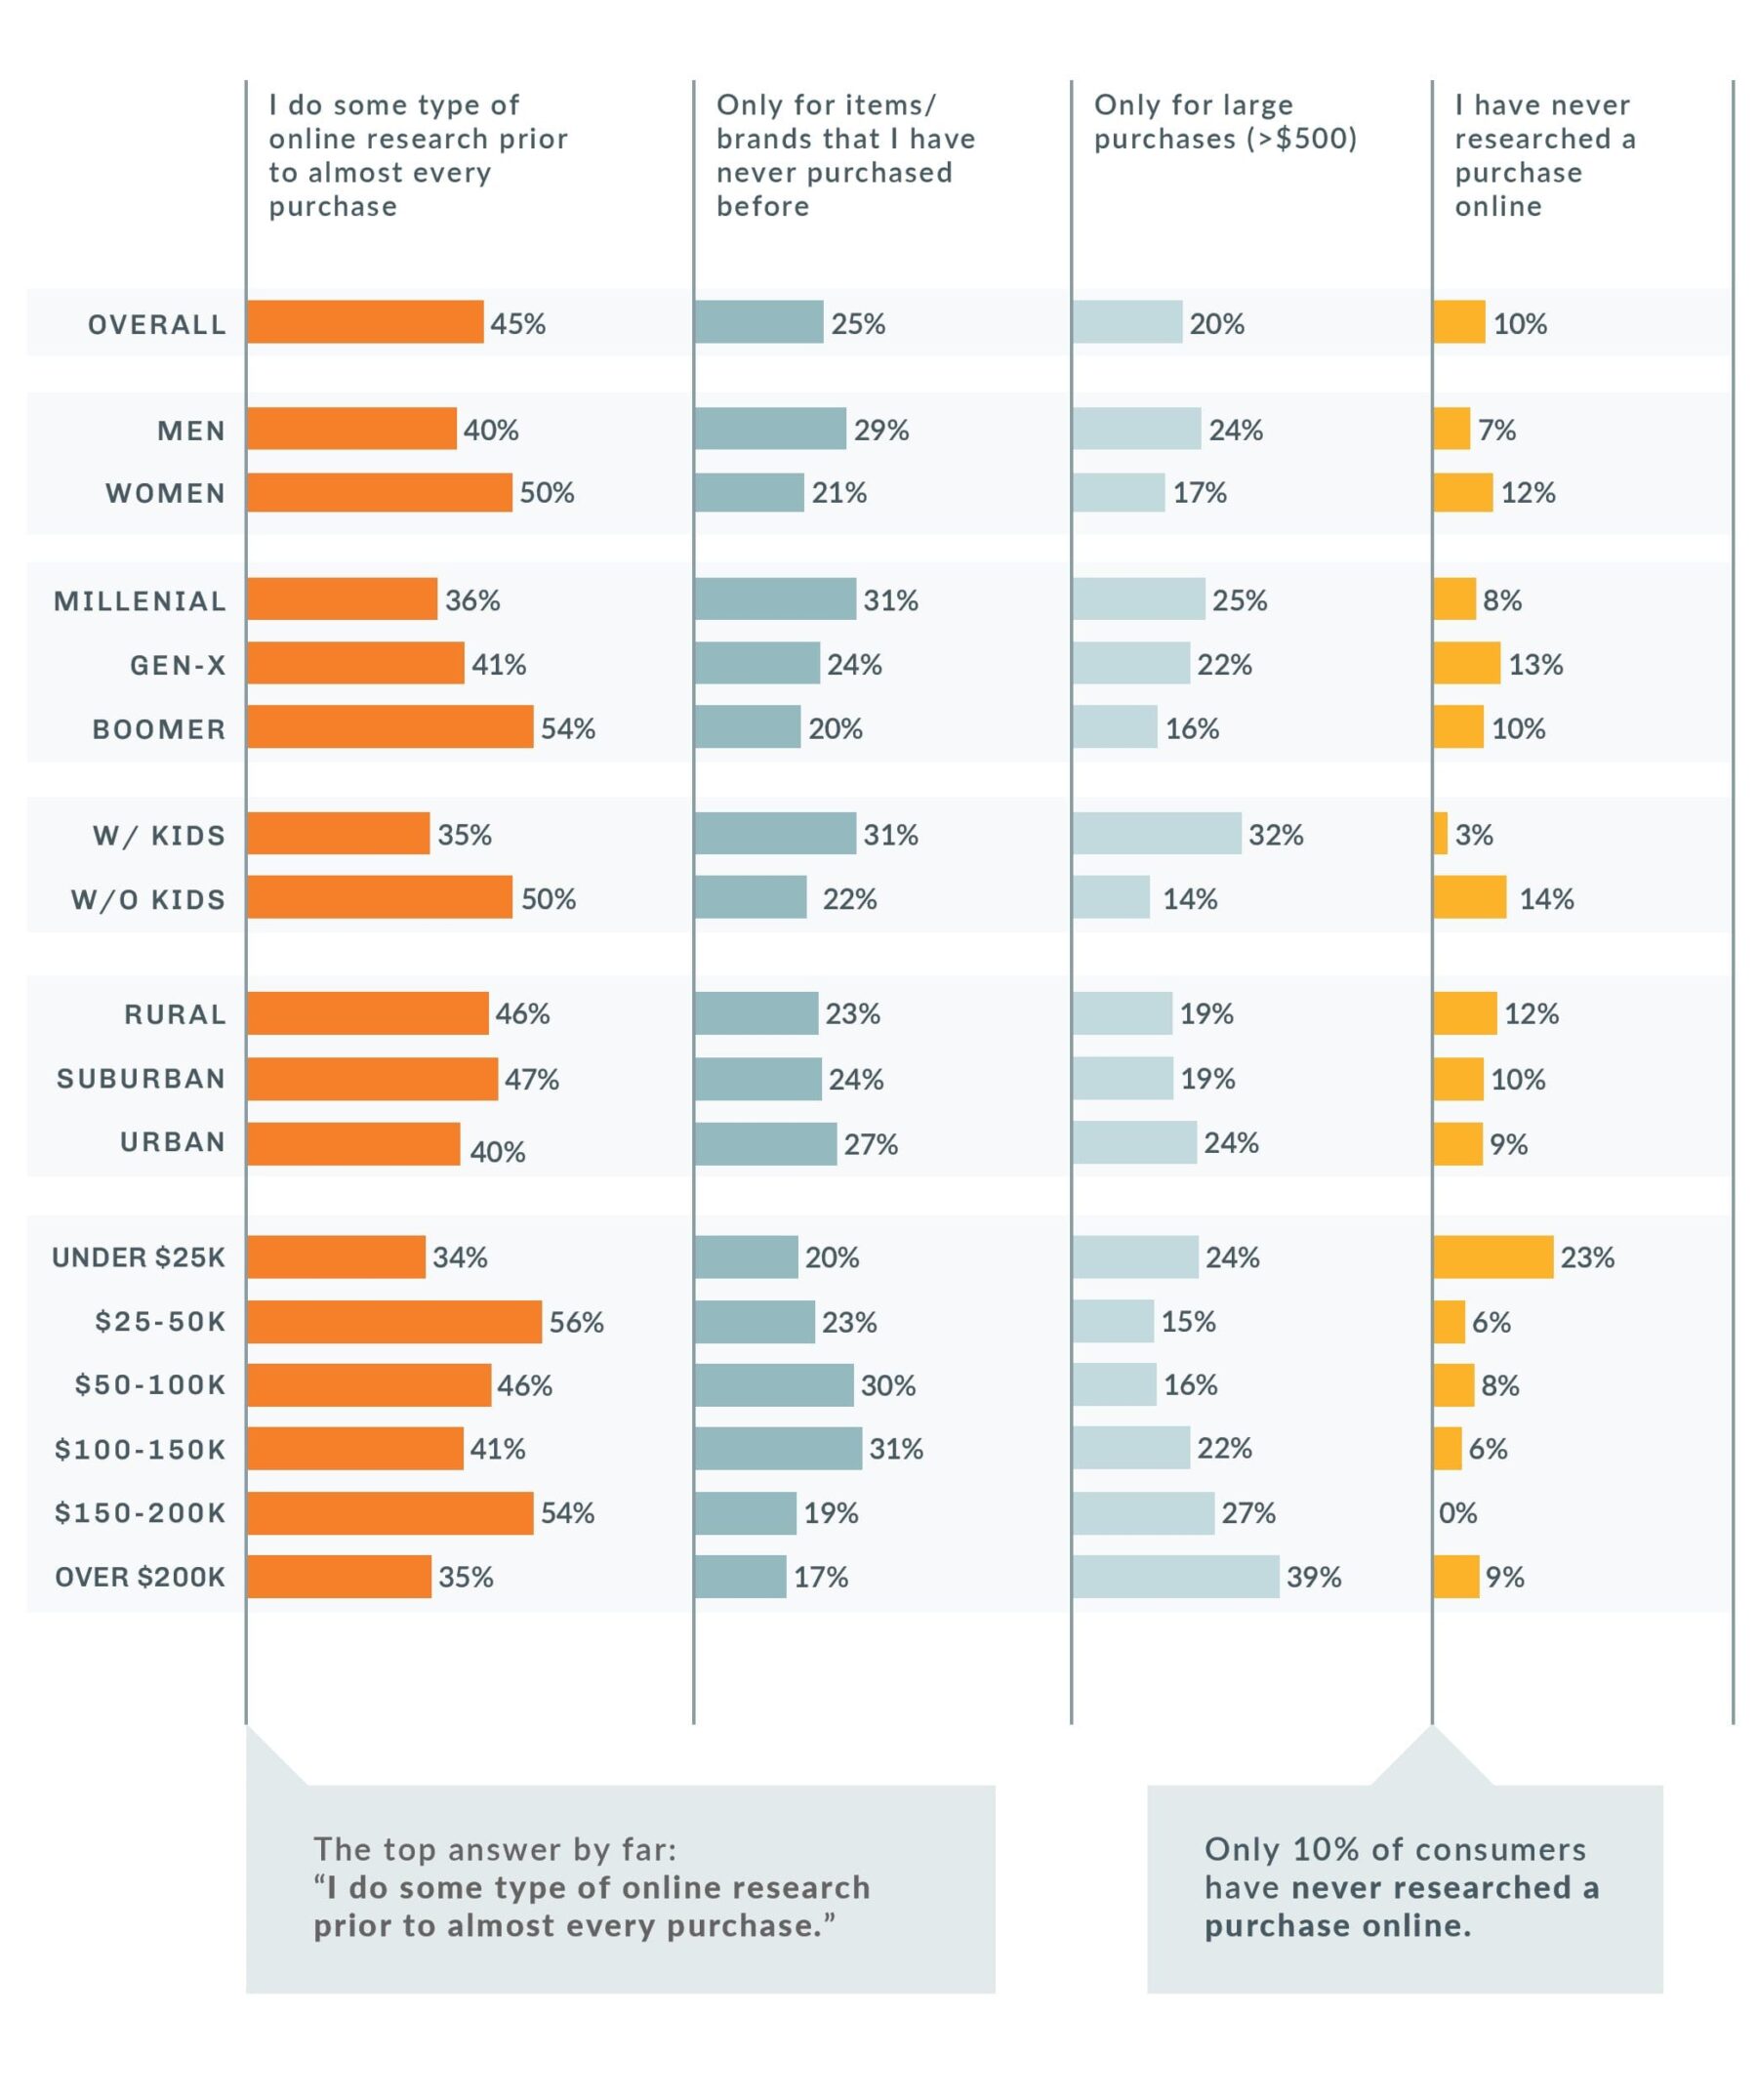
Overwhelmingly, consumers engage in some form of online research (comparing prices, reading consumer reviews, etc.) before making a purchase. Only 10% say they have never researched a purchase online.
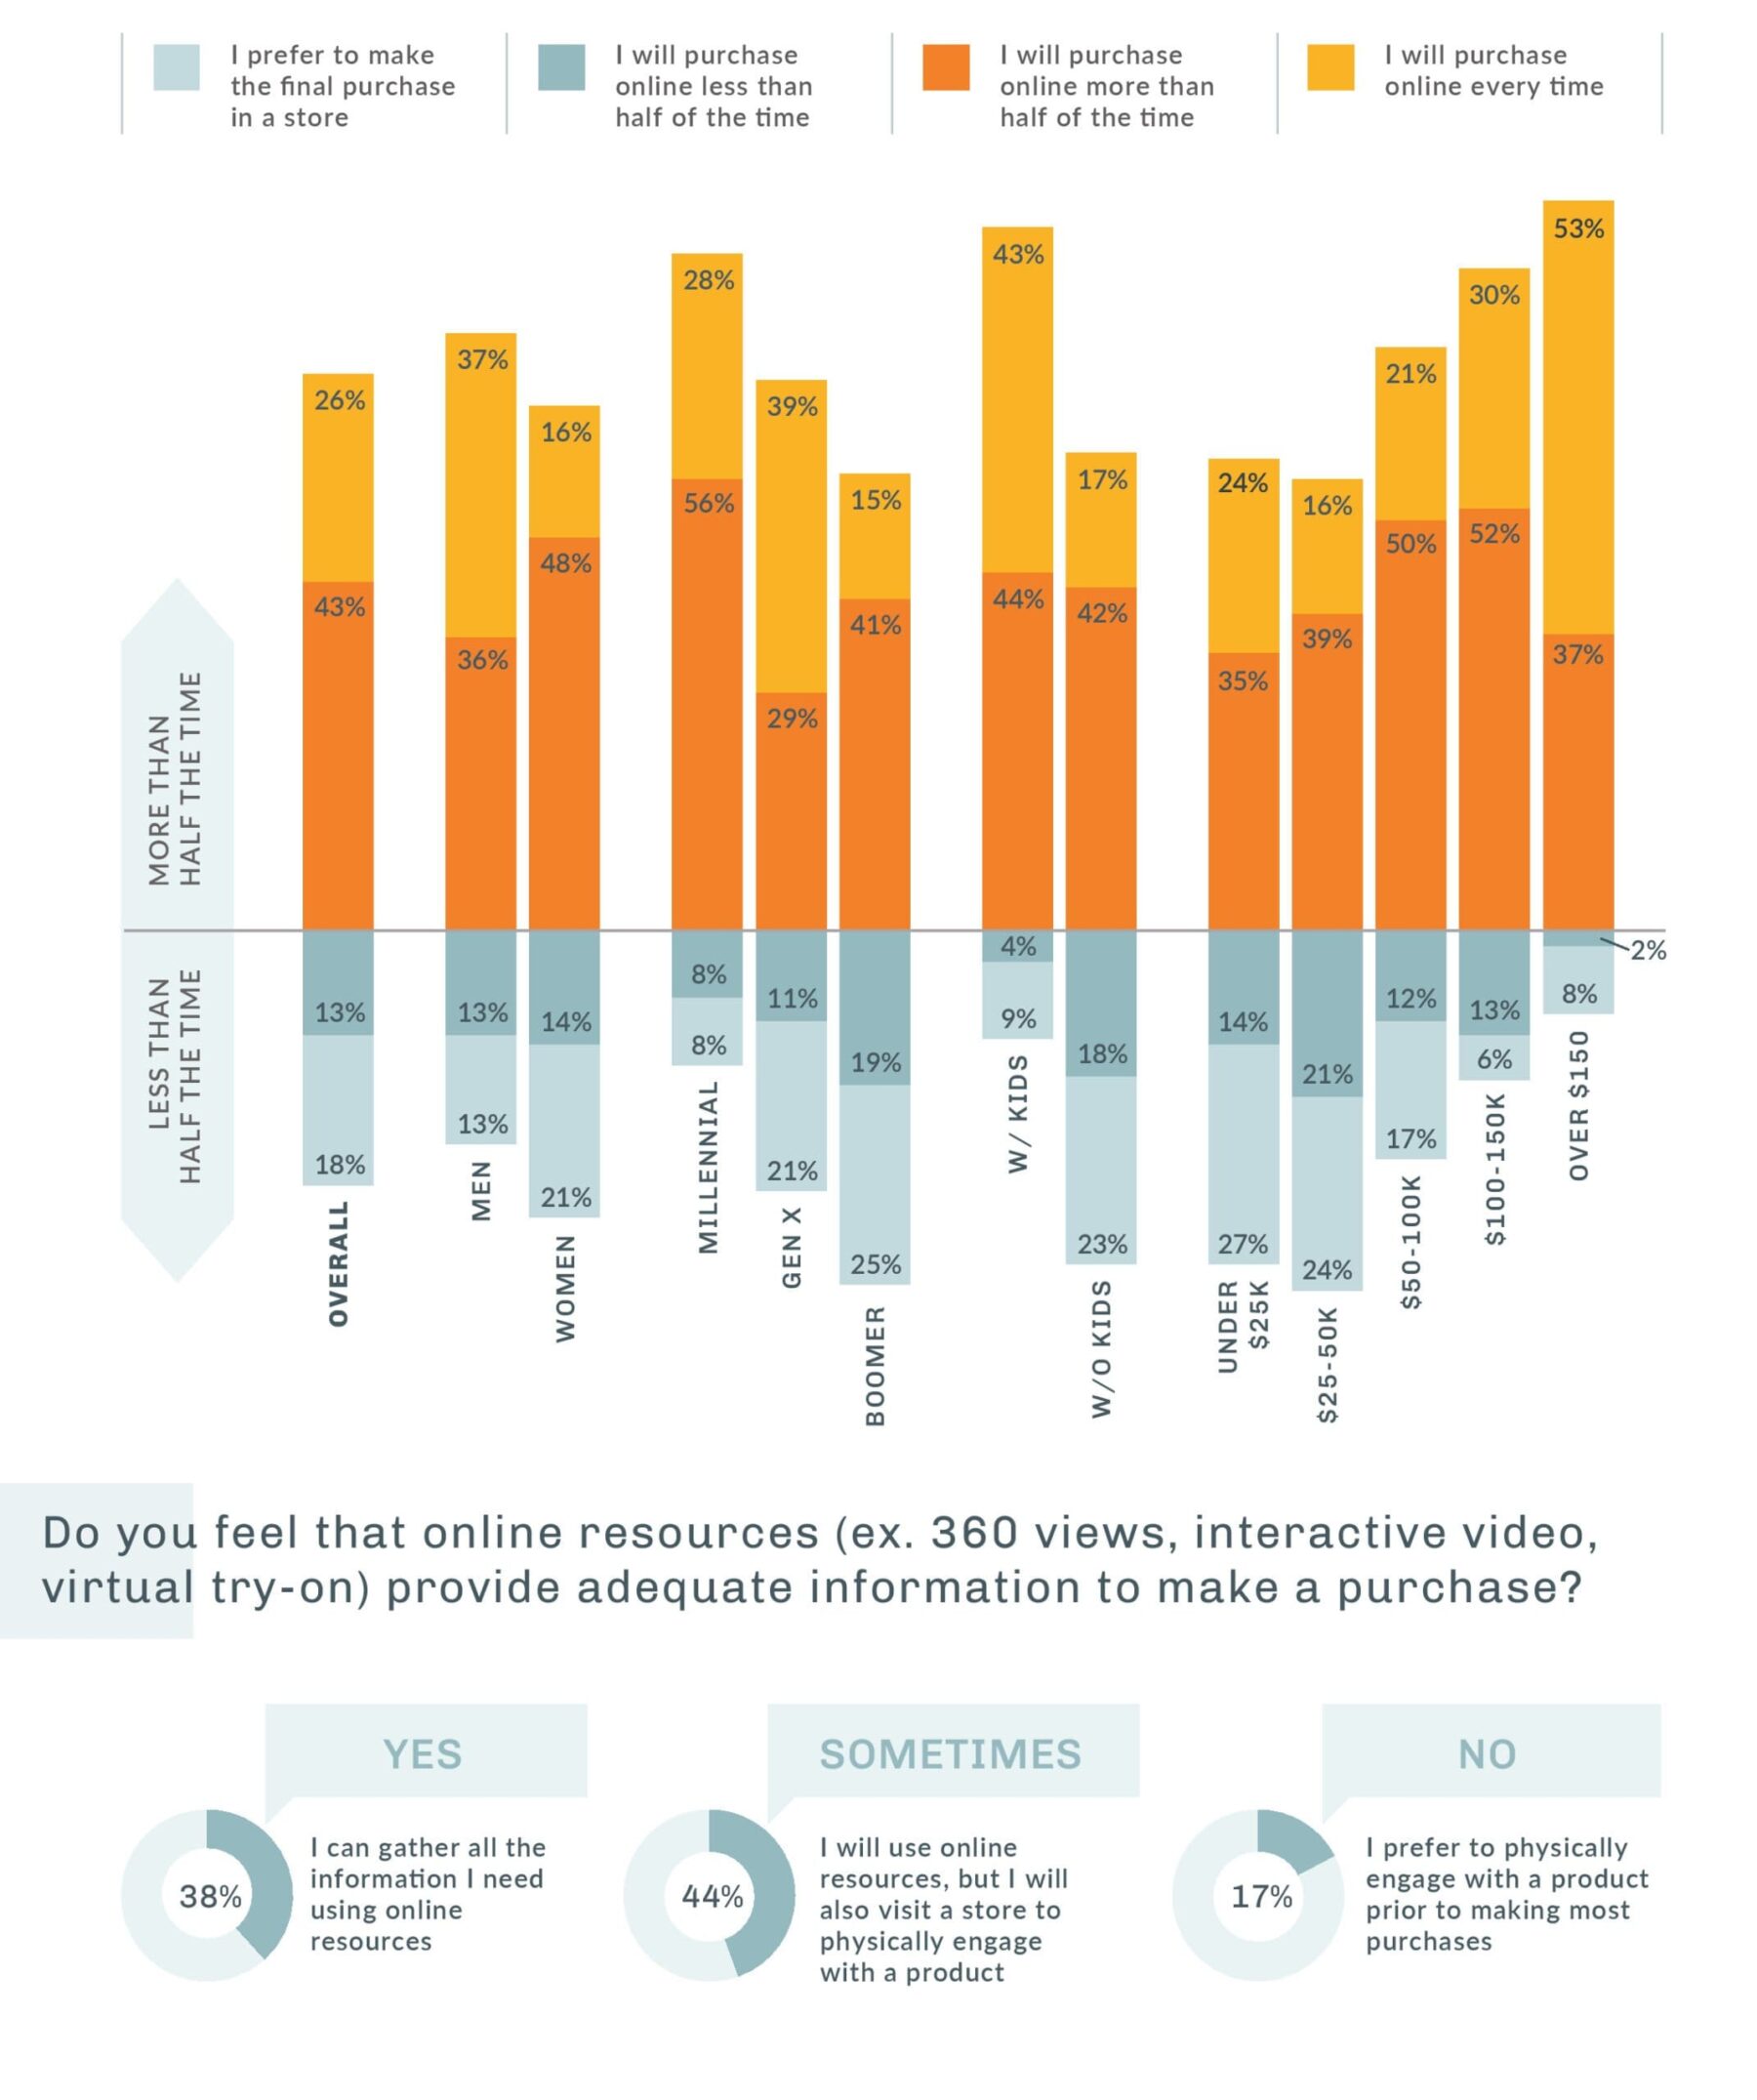
Once it’s time to buy, 18% will make the transition to purchasing in a brick-and-mortar shop while the majority will finish the transaction online at least half of the time.
The percentage of shoppers who switch to an in-person experience matches those who prefer to physically engage with a product prior to making most purchases (17%).
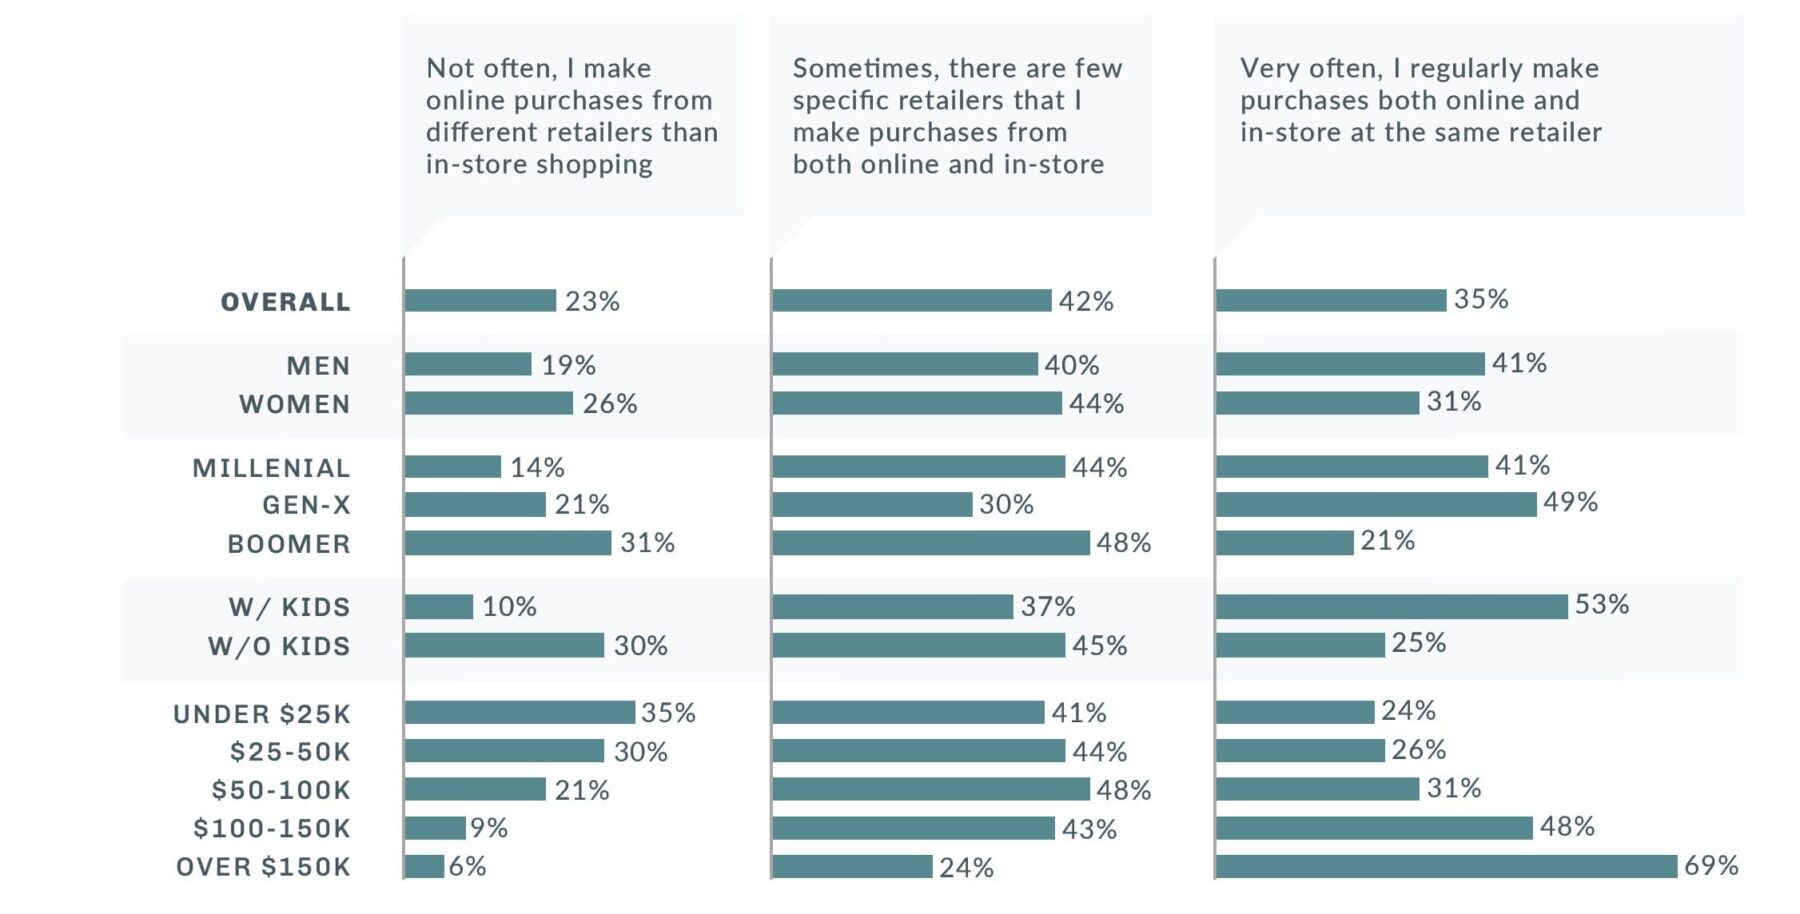
The distinction between online and in-store shopping blurs when a retailer offers both options, with 77% of shoppers at least sometimes using both methods to buy from the same retailer.
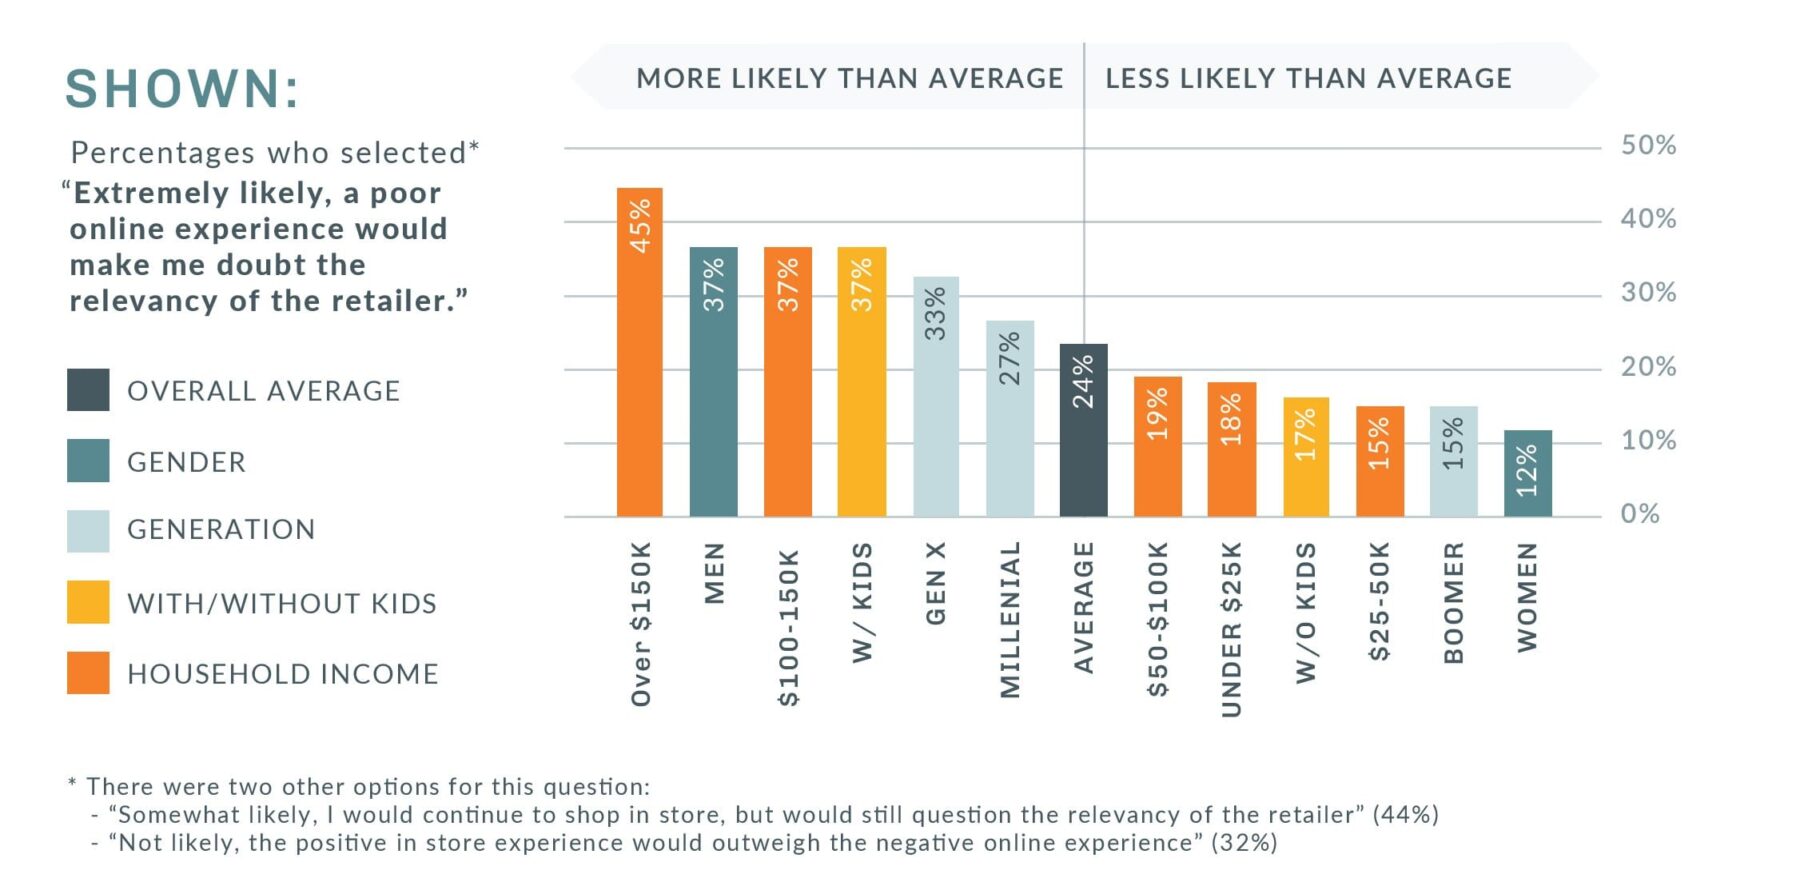
The risk of offering an online shopping experience, however, is that it may result in consumers losing confidence in the retailer overall. Negative online experiences, such as a non-mobile-friendly website, are either somewhat likely or extremely likely to make 68% of consumers doubt the relevancy of the retailer.
Boomers are the most forgiving, with 45% stating that “the positive in-store experience would outweigh the negative online experience.” Consumers with incomes over $200k are the most likely to have a carryover from a negative experience, with only 13% weighing a positive in-store experience over a negative one online.
How often do you research an intended purchase online (compared price, read consumer reviews, etc.) prior to making a final purchase?
After researching a purchase online, how likely are you to make the purchase online rather than in a store?
How often do you make purchases both online and in-store at the same retailer? For example, if you regularly visit a Target store, do you also make purchases at Target.com?
If you have a positive in-store experience but a negative online experience (ex. diffcult to navigate website, lack of options, etc.), will it negatively affect your perception of that retailer?

Buy Online, Pick Up In Store
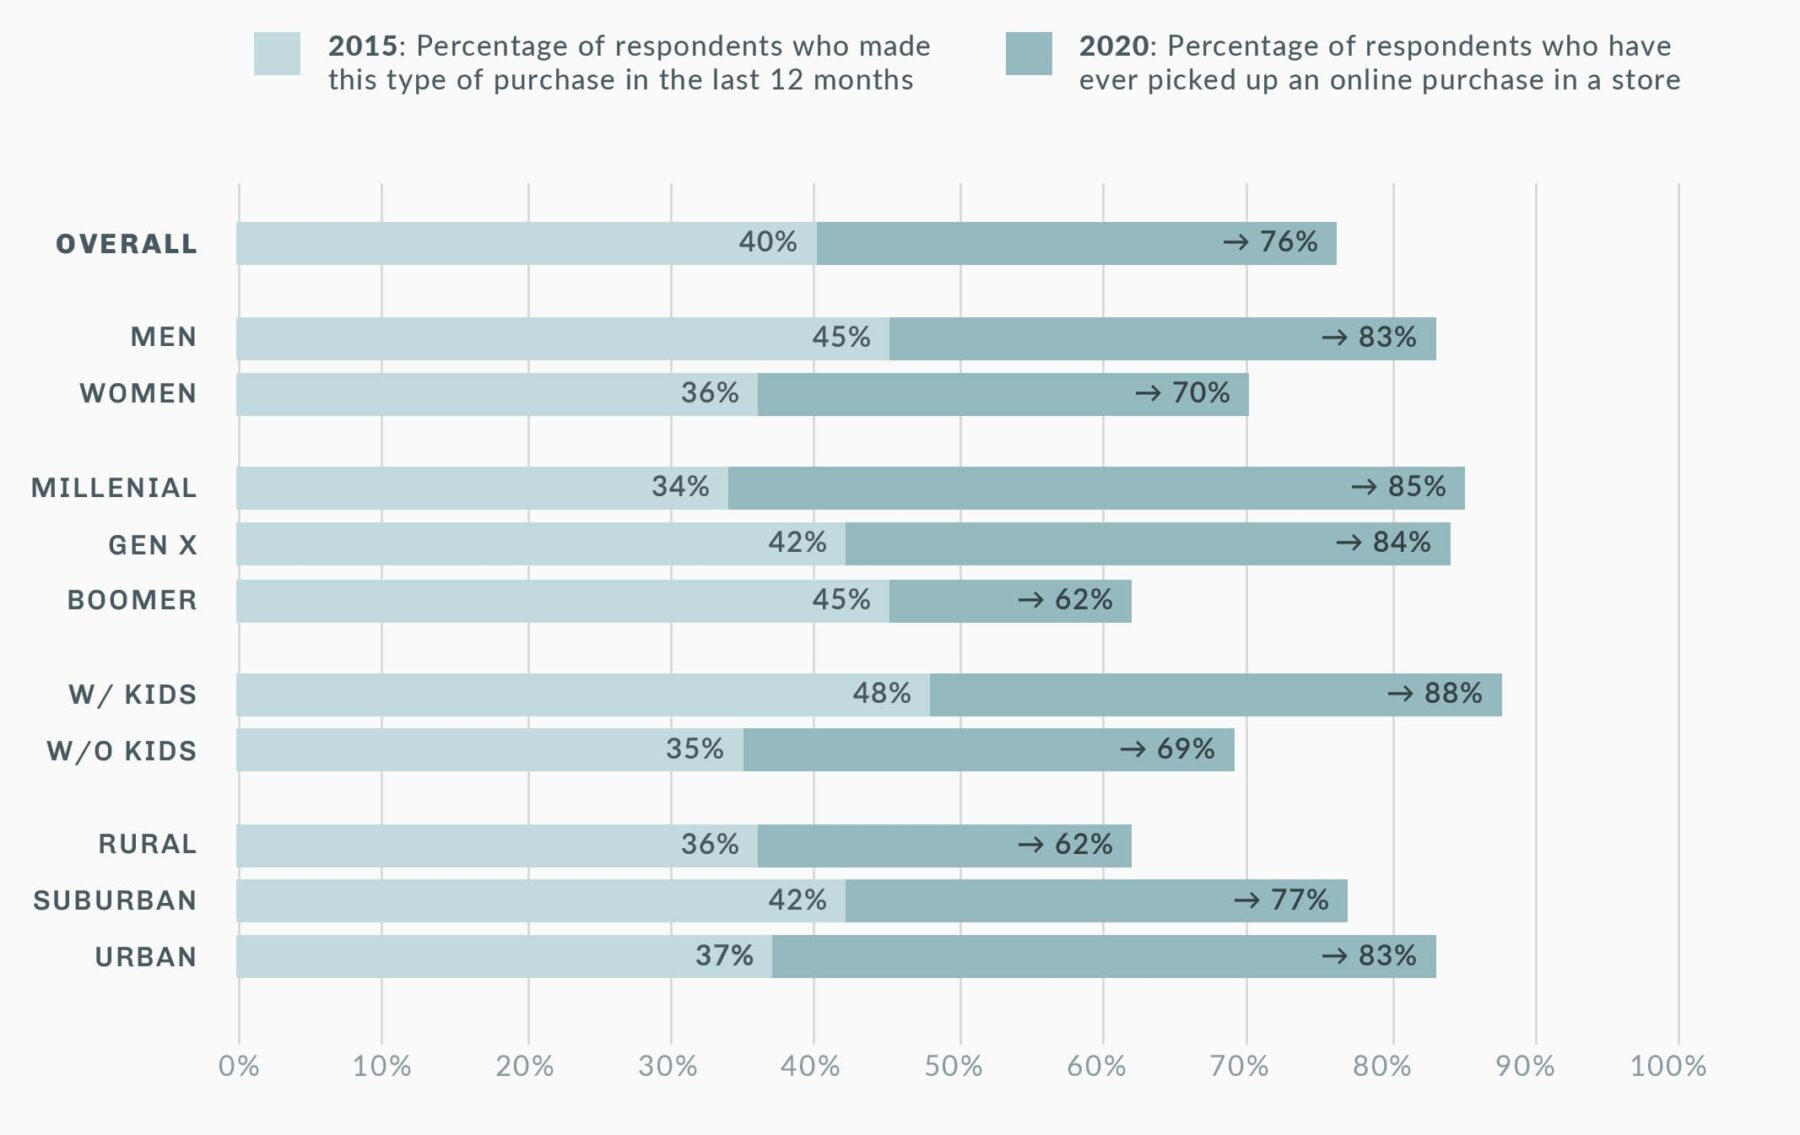
Millennials alone more than doubled their use of this option, going from 34% to 85%.
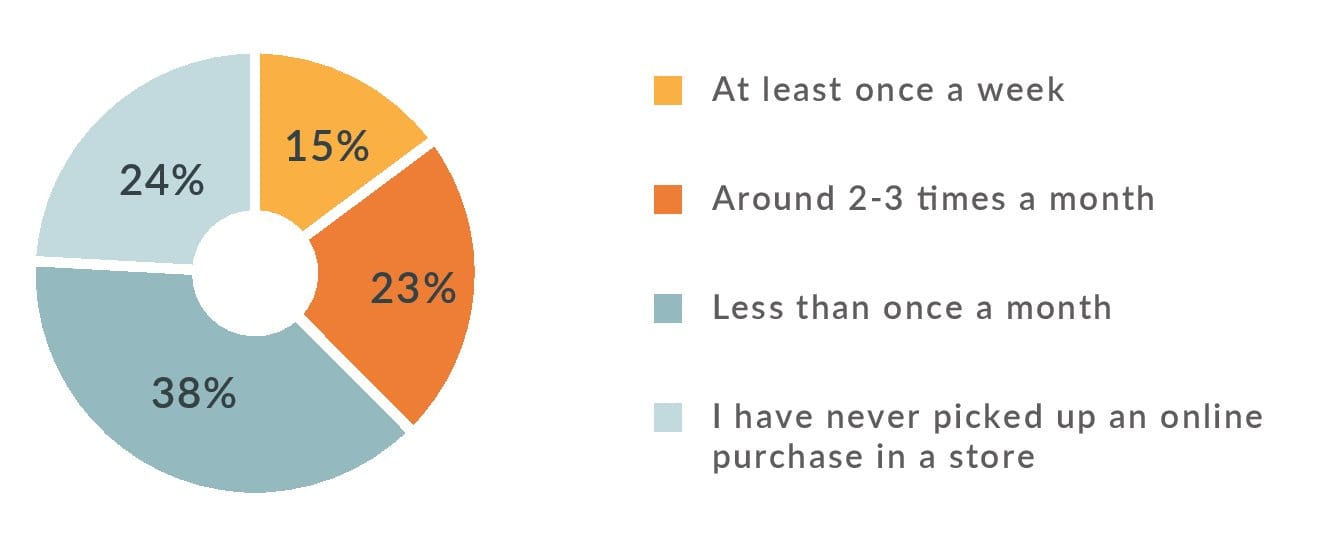
At 94%, consumers with incomes over $200k constitute the largest demographic shopping online for in-store pickup. And while Boomers and Rural consumers use this shopping method the least out of all consumers, over half of them (62% each) have picked up an online purchase in a store.
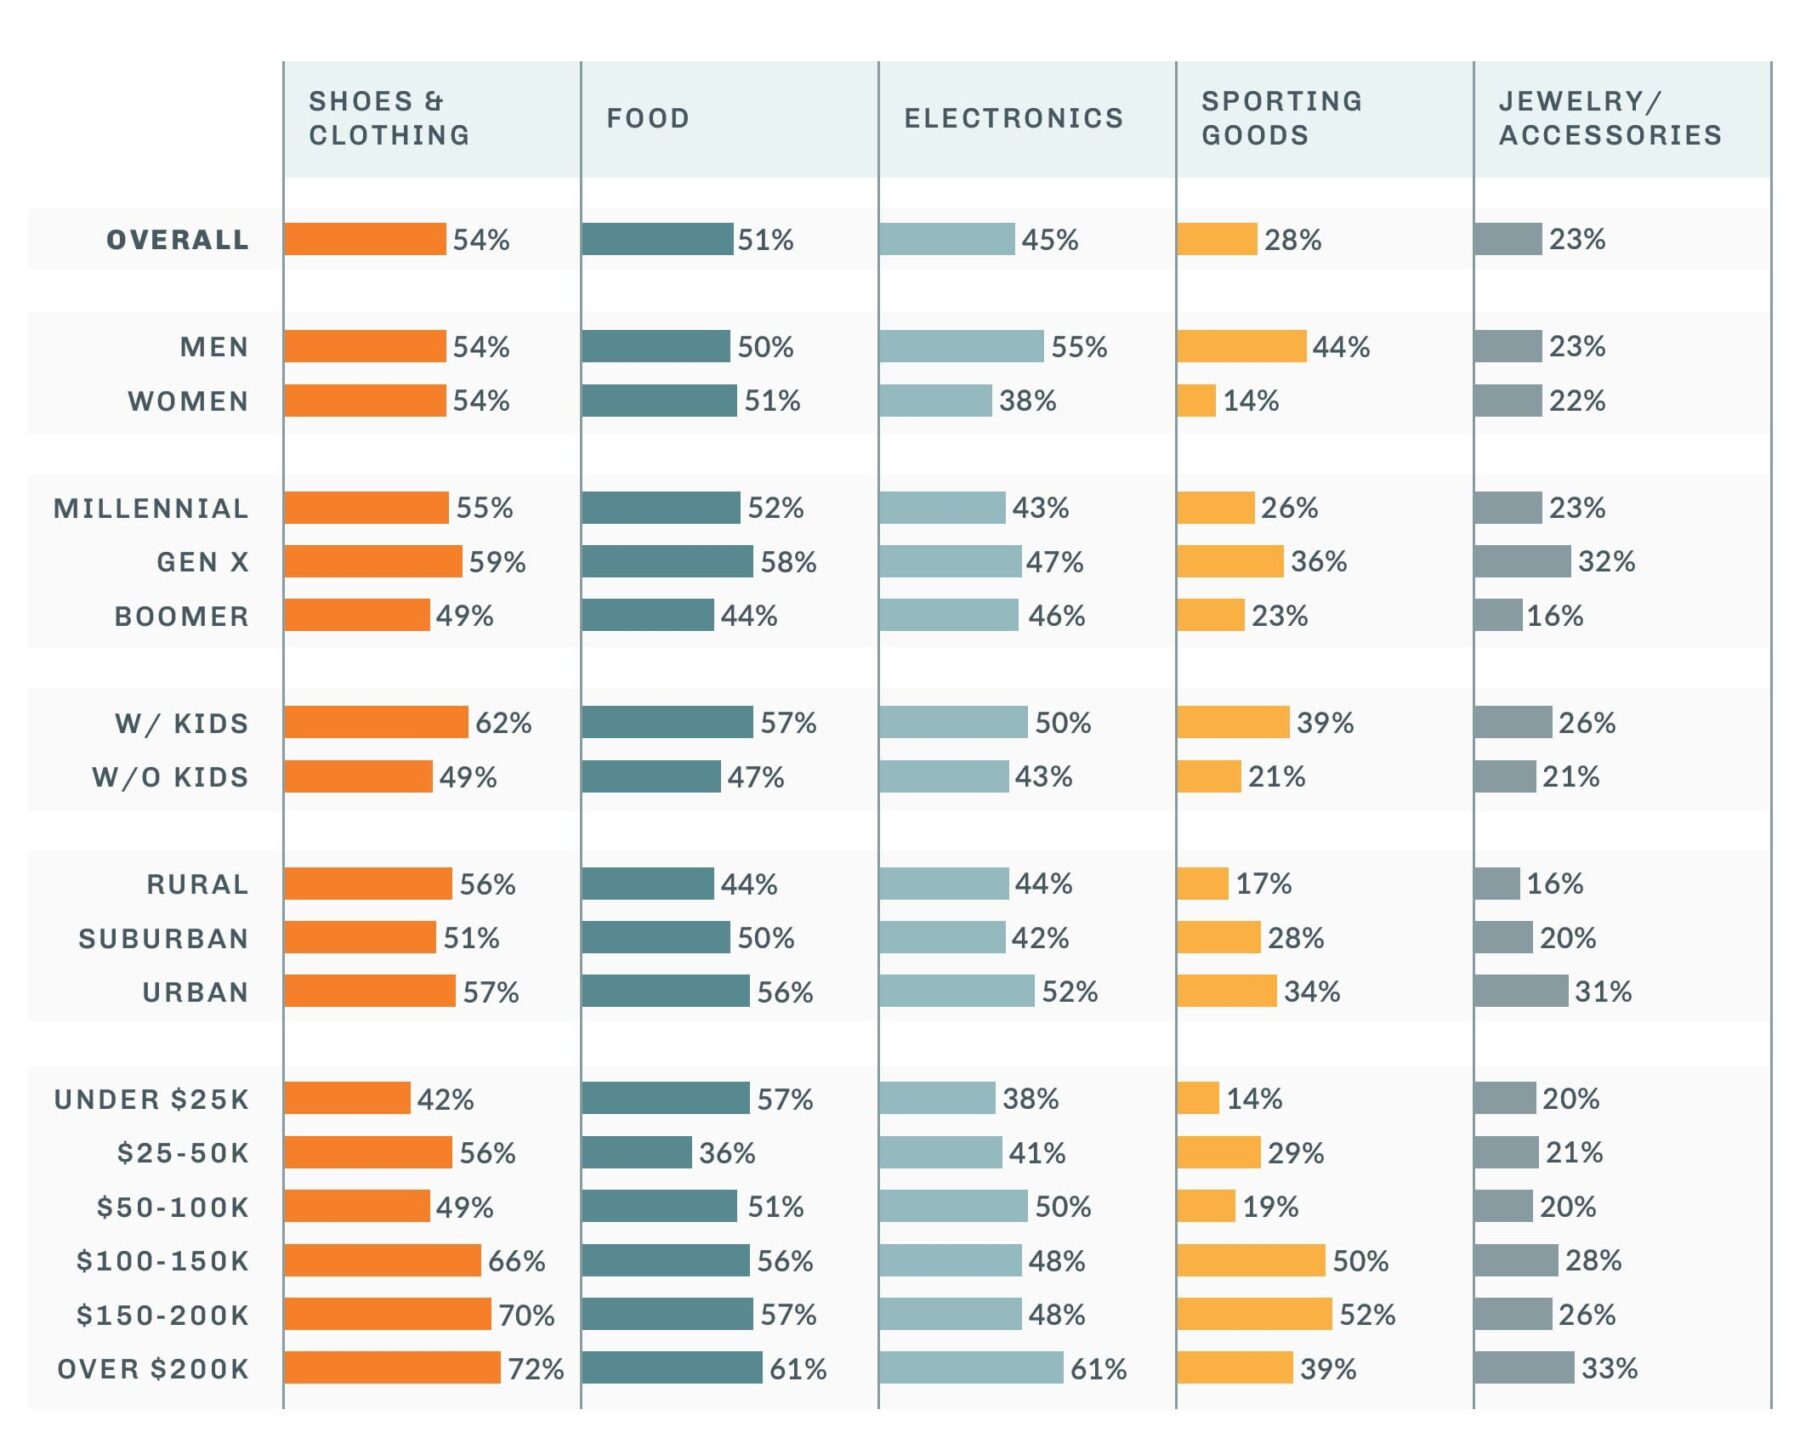
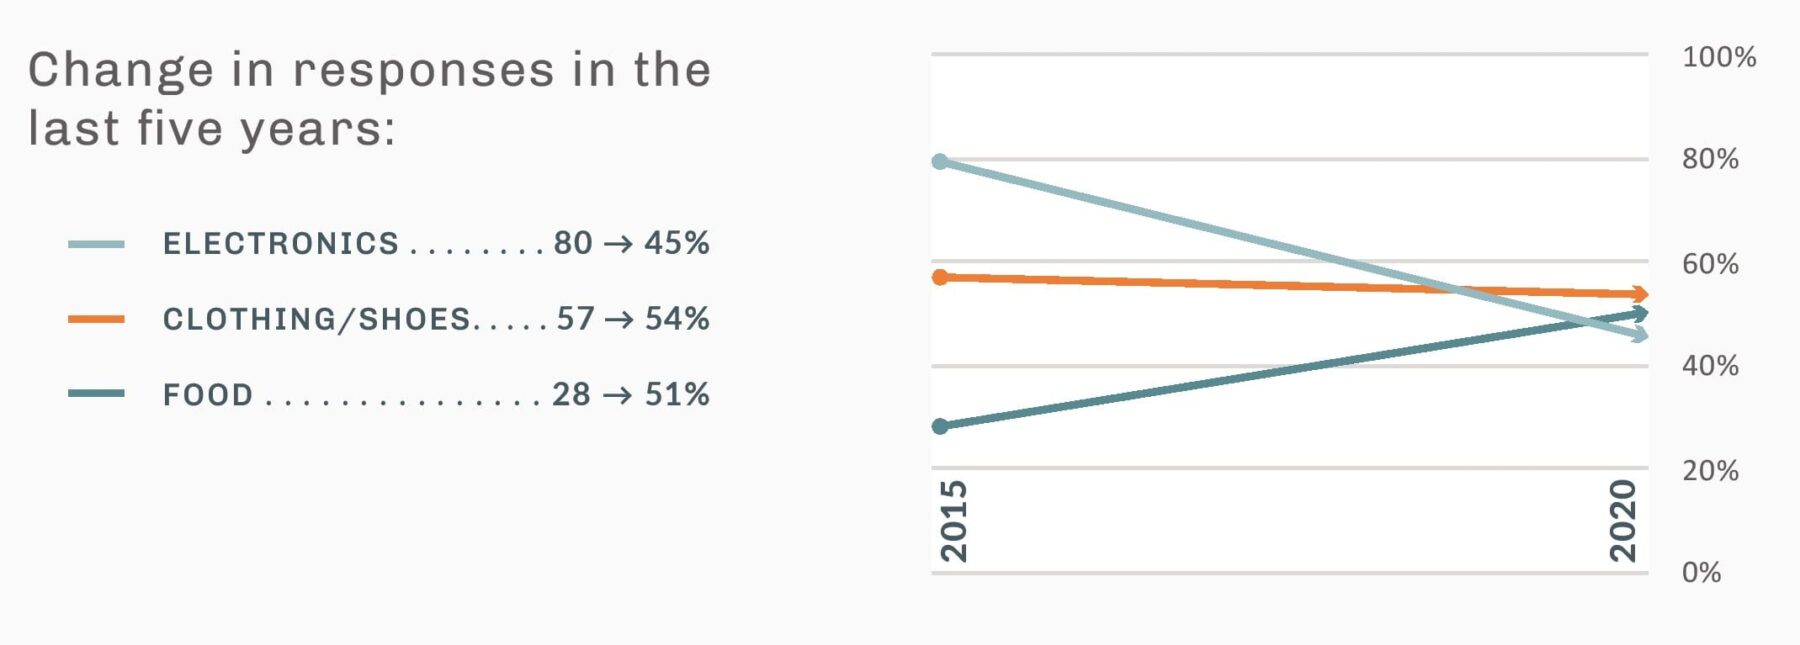
While shopping online for in-store pickup has seen substantial growth overall in the last five years, willingness to purchase electronics this way has plummeted from 80% down to 45%. That trend has reversed in the purchasing of food, going from 28% to 51%.
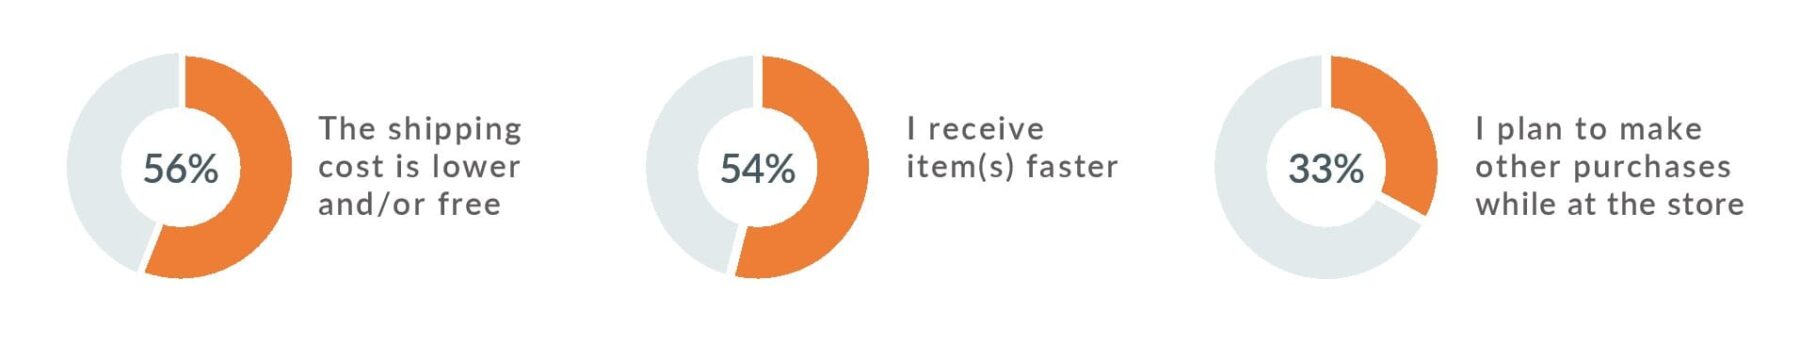
This year, we asked consumers what factors influence their decision to choose in-store pickup. The top two answers–faster and less expensive than shipping–varied depending on demographic and were within a couple of percentage points from each other overall. Planning to make other purchases while at the store came in at a distant third. The responses of those who selected “Other” fell into two main buckets: delivery being unavailable and the ability to physically inspect the merchandise.
How often do you shop online and pick up your purchase in a store (rather than having it delivered)?
Factors that influenced shoppers to choose in-store pick up:
In-store pick up from 2015 to 2020:
What types of items would you purchase online and pickup in-store?

Subscription Services
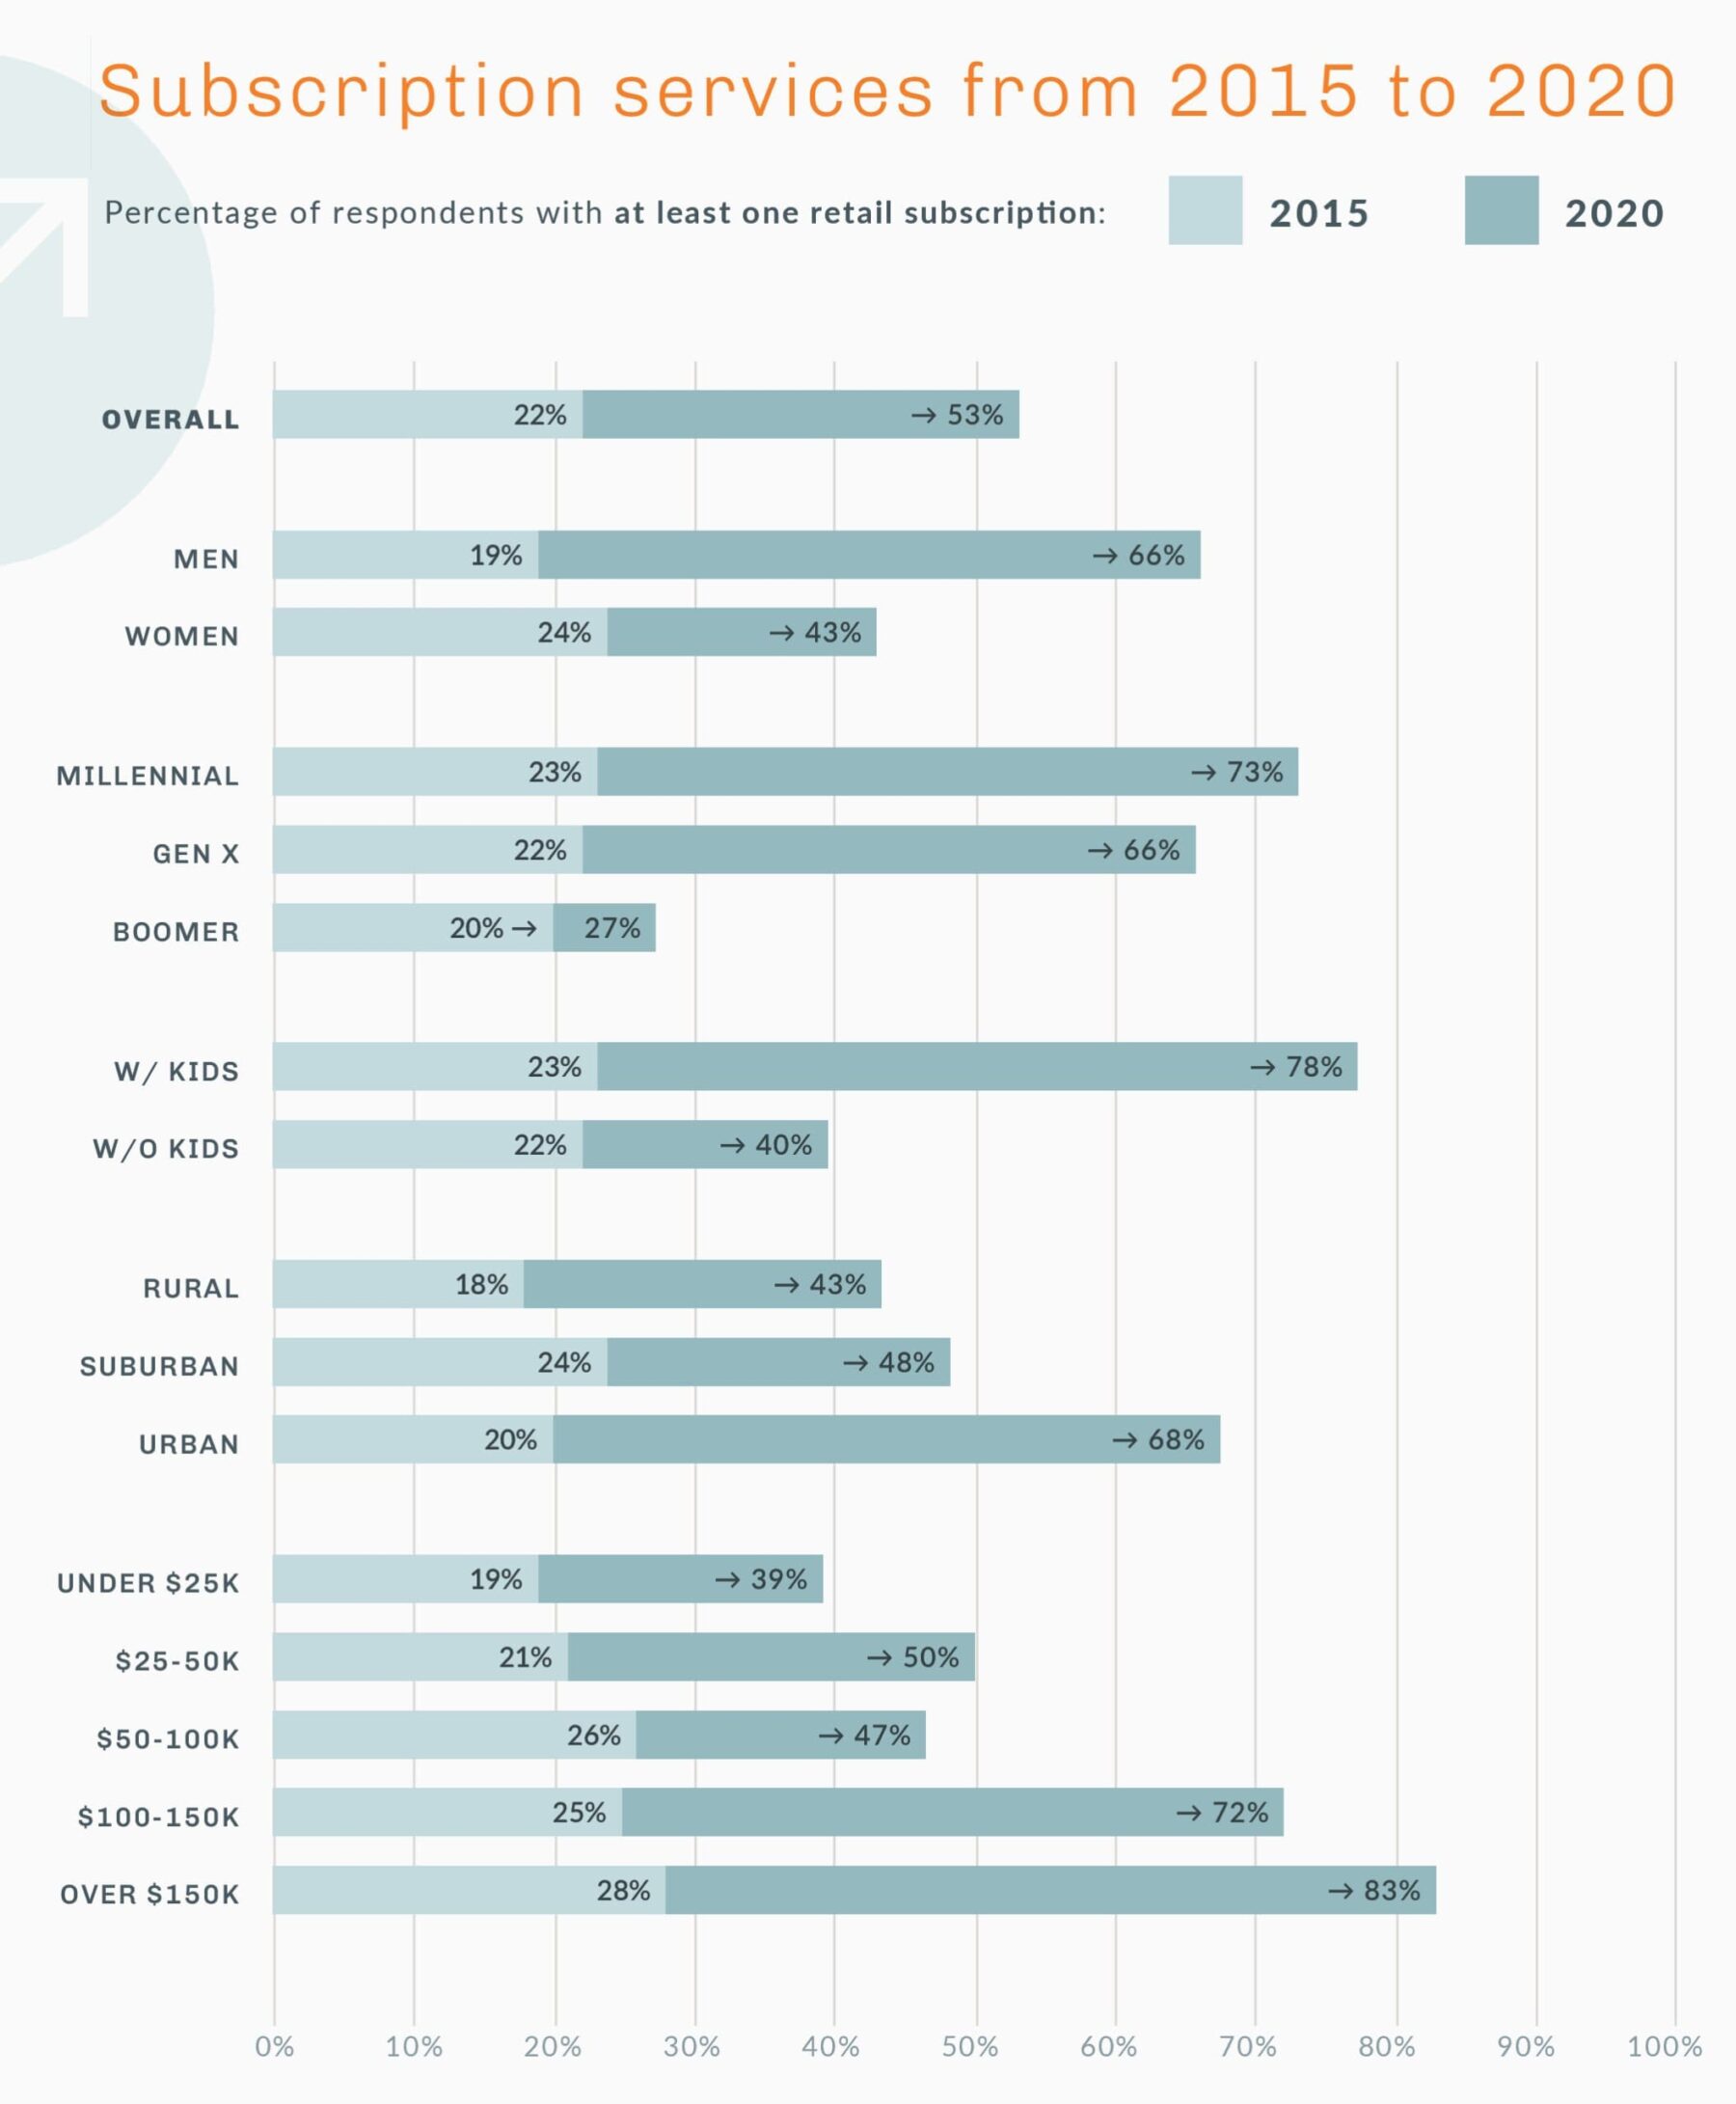
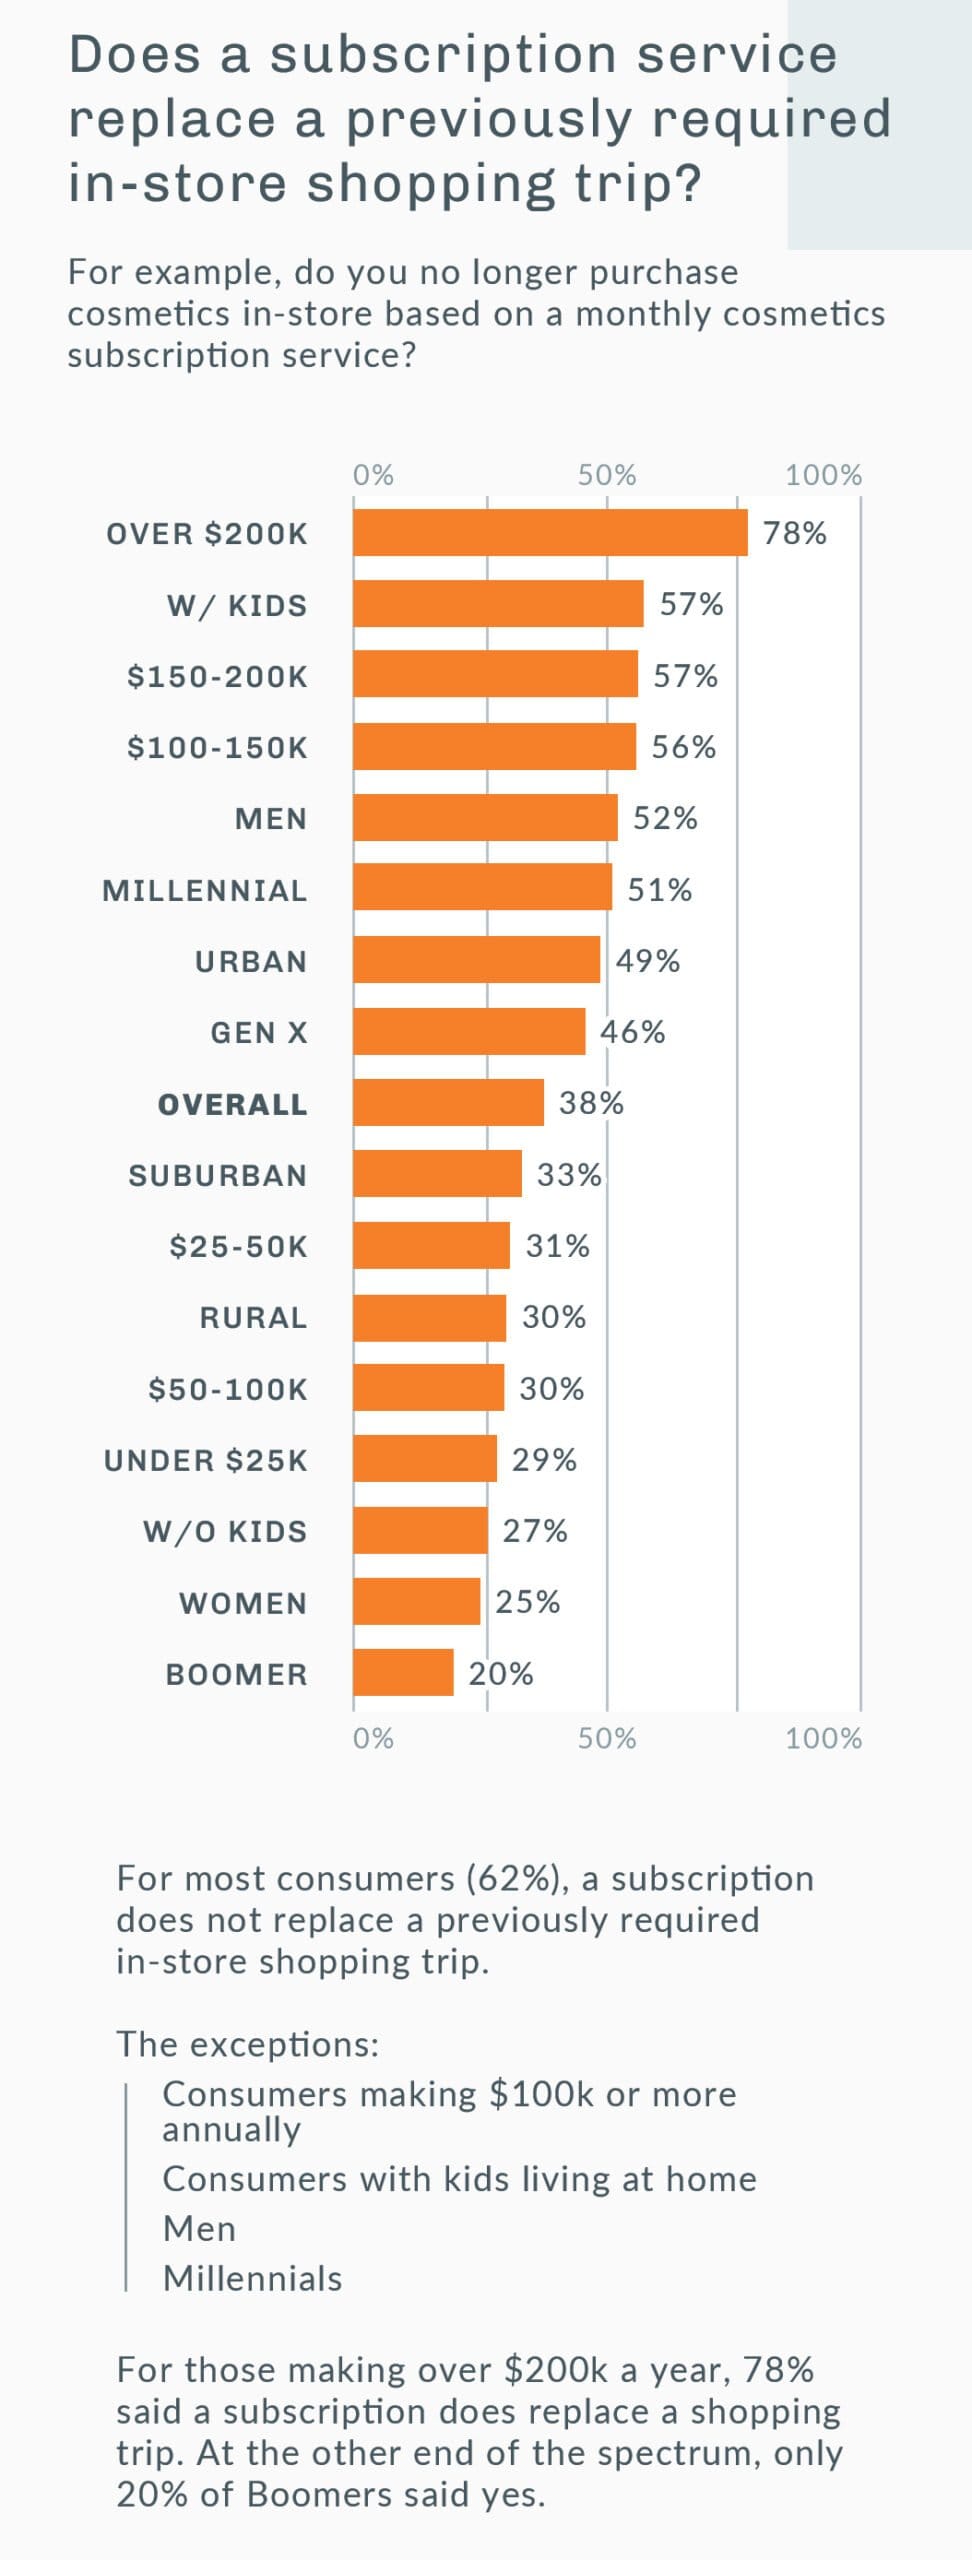
In 2015, we reported that 1 out of 5 consumers was signed up for an ongoing “subscription” retail purchasing agreement. This year that ratio has shifted significantly:
1 out of every 2 consumers is now signed up.
Shoppers with at least one kid living at home had the highest increase with a jump from 23% up to 78%.
Millennials who subscribe to a service increased by 50 percentage points (from 23% up to 73%), compared to Boomers, who had the least amount of growth of any demographic, with a scant seven percentage point increase (from 20% to 27%). That also makes Boomers the least likely to subscribe to a service overall. Consumers with an income of over $200k annually are the most likely to have a subscription, with a whopping 89%.
Which ongoing "subscription" services are you signed up for? ?
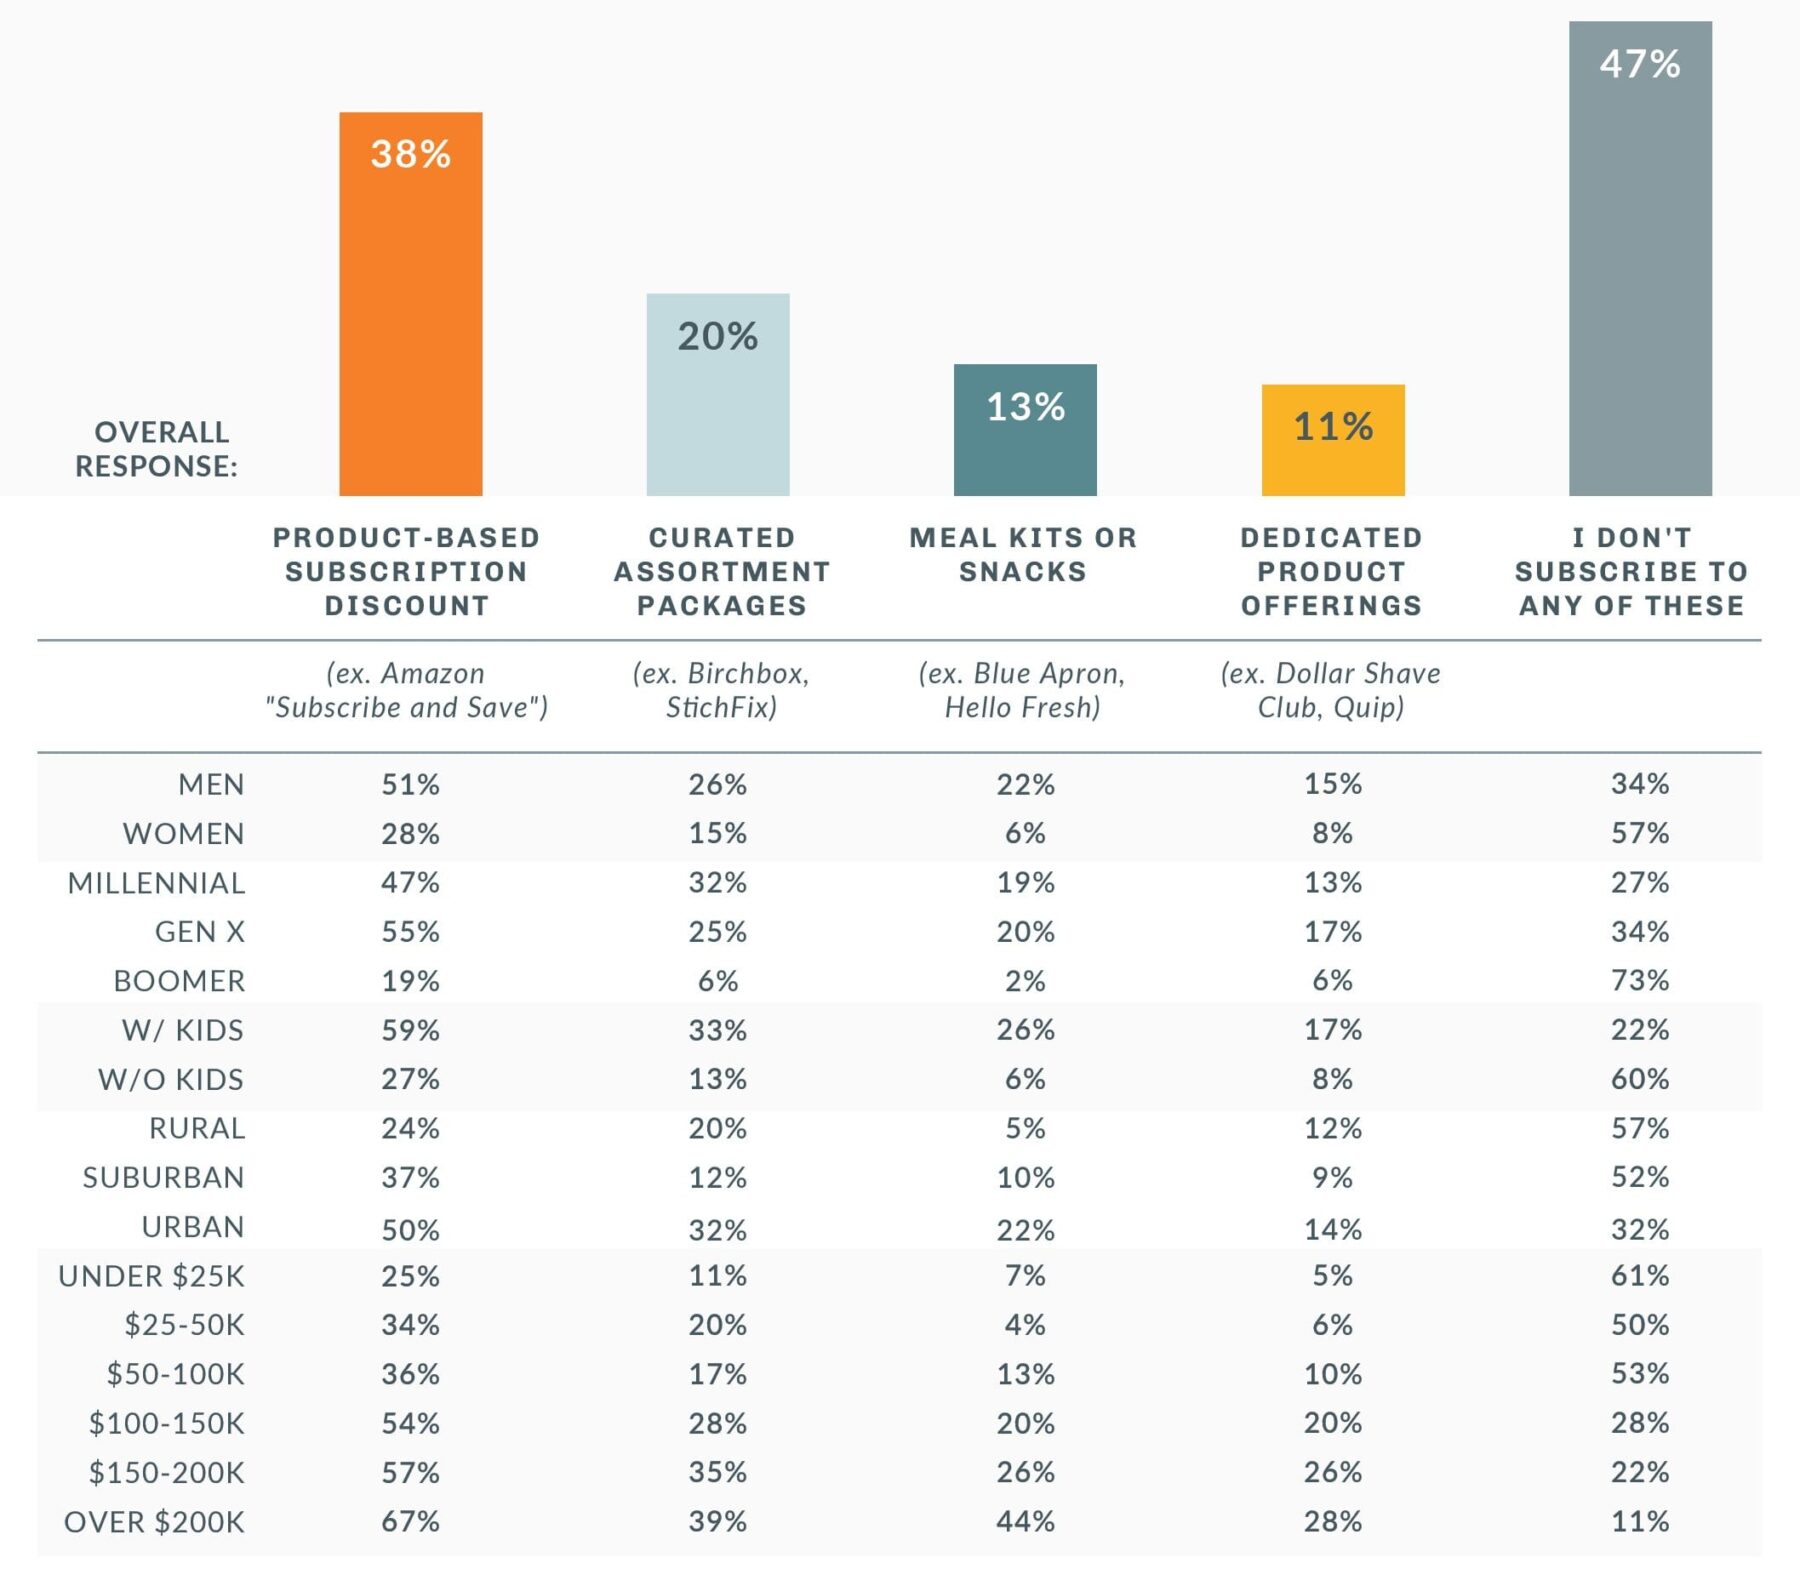
Product-based subscription discounts (such as Amazon “Subscribe and Save,” Target subscriptions) hold the number 1 spot across all demographics.
The least-subscribed services are dedicated product offerings, except for the in the following demographics, whose least-subscribed option is meal kits or snacks:
Boomers
Consumers without kids at home
Rural consumers Consumers with incomes between $25-50k
Consumers making between $100-200K put both of those services in a tie for last place

Shopping Experience
We asked consumers to tell us about the last time they felt delighted or otherwise impressed by a shopping experience. They were able to free-form enter the name of the store as well as the reason they were delighted.
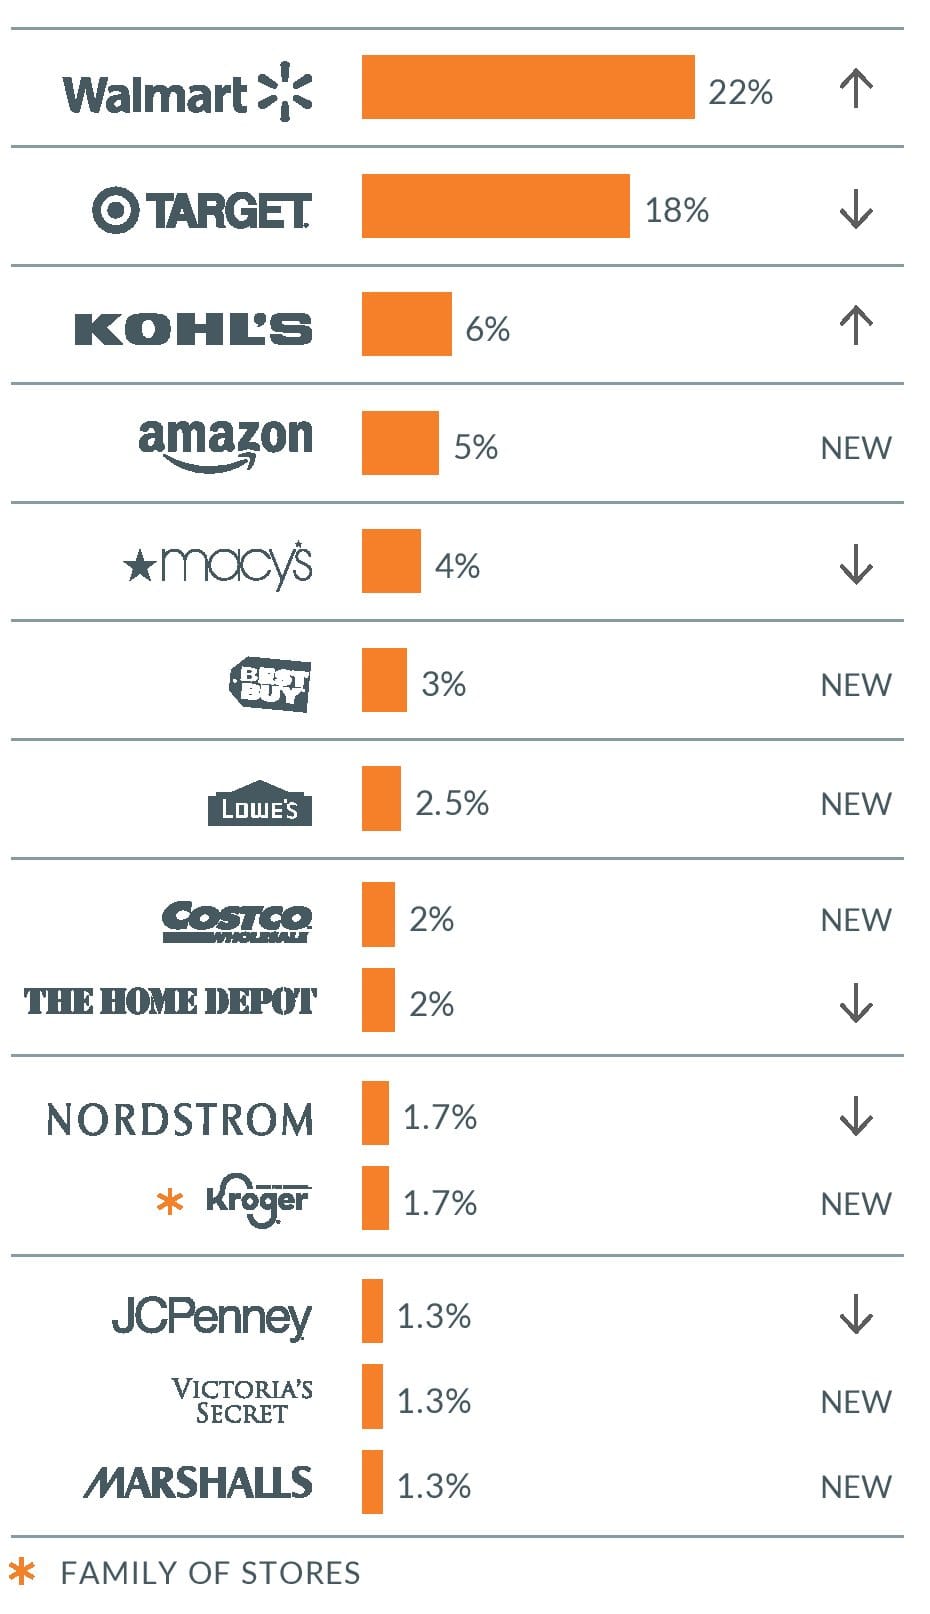
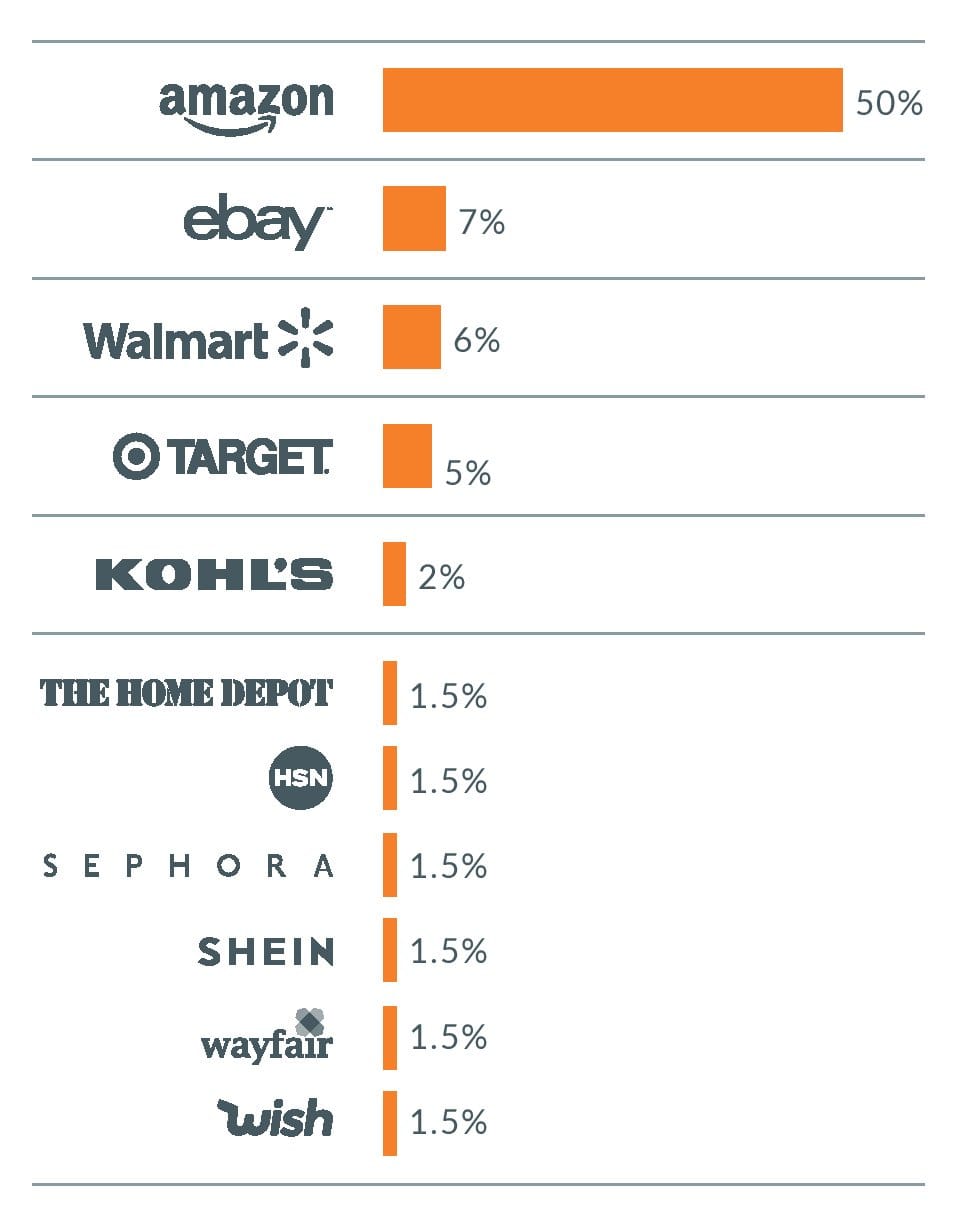
This year also shows a shakeup in the Top 3 spots for the first time. Macy’s dropped out of the Top 3, coming in solidly in fifth place. Kohl’s joined the top two anchors, Walmart and Target, at the top of the list.
Old Navy dropped out of the top 10 list from 2015 (as did Sam’s Club, Kmart, Publix, and TJ Maxx/Home Goods from 2016). Joining Amazon as new entries are Lowe’s, Kroger, Victoria’s Secret, and Marshalls. The differences between companies are razor-thin this year, with a two-way tie for both 8th and 9th place and a three-way tie for the final spot, resulting in a top 10 list that has 14 companies listed.
Walmart has a clear majority at 22% while all three of the number 10 spots only have a little over 1% of the tally each.
2020's Most Delightful Retailers
Think of the last time you were
shopping IN A STORE and felt
delighted or otherwise
impressed by the experience.
Which store were you in?
Despite the emphasis on “IN STORE,” Amazon still scored a 4th place finish with 5% of respondents typing it in.
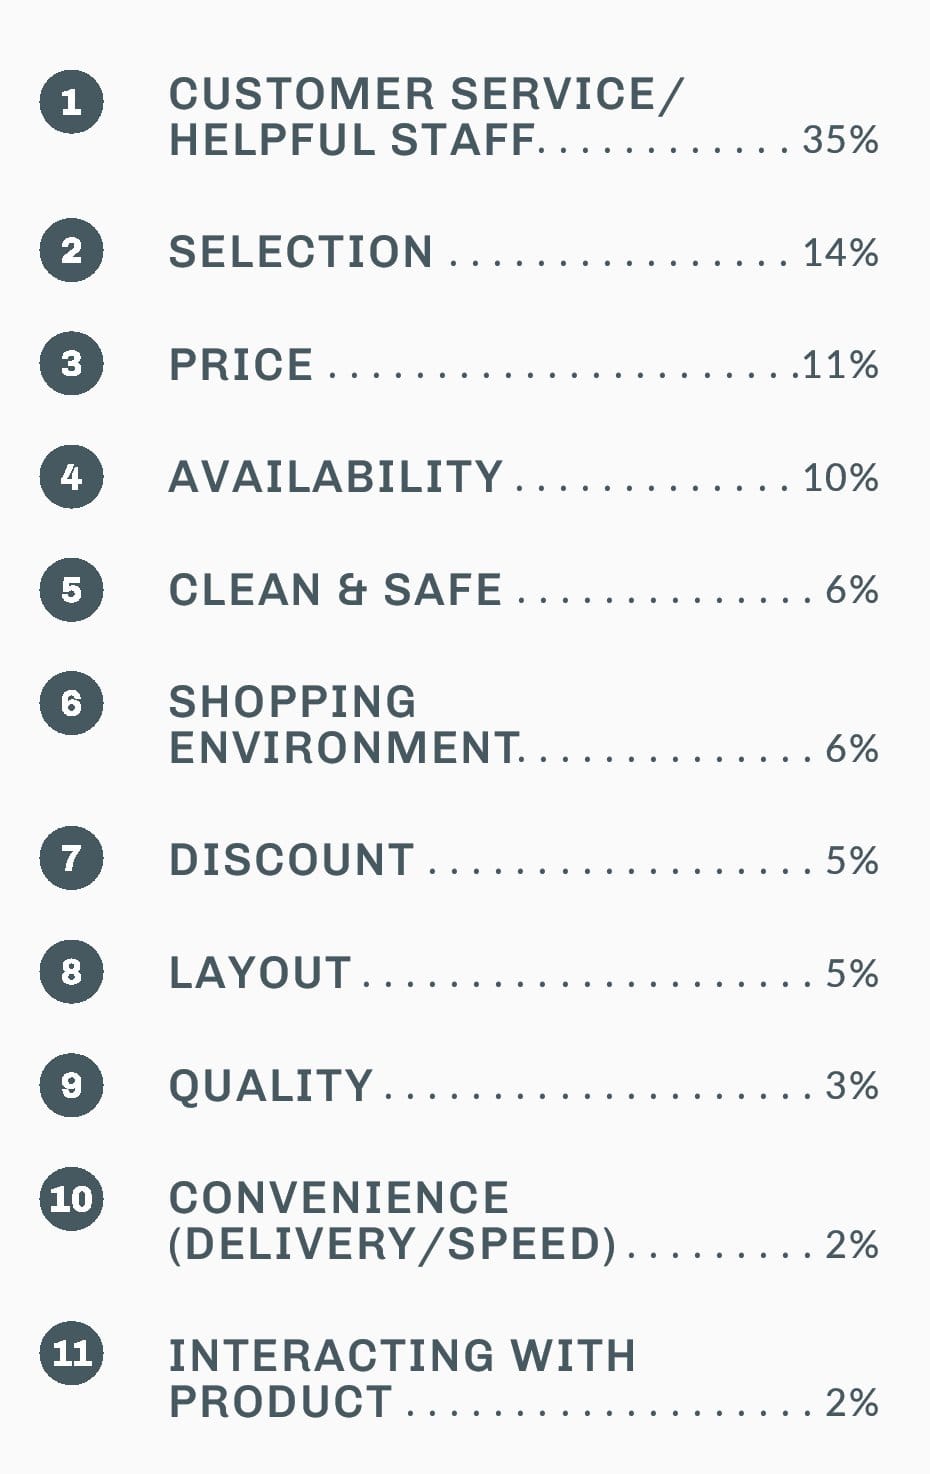
What Caused the Delight?
The reasons given fit into 11 categories, with
customer service/helpful staff having a
dominating influence at 35% of the responses
and maintaining the number 1 spot it also had
in 2015.
Unlike five years ago, when consumers
selected price as the second reason for
delight, this year sees selection go up a spot.
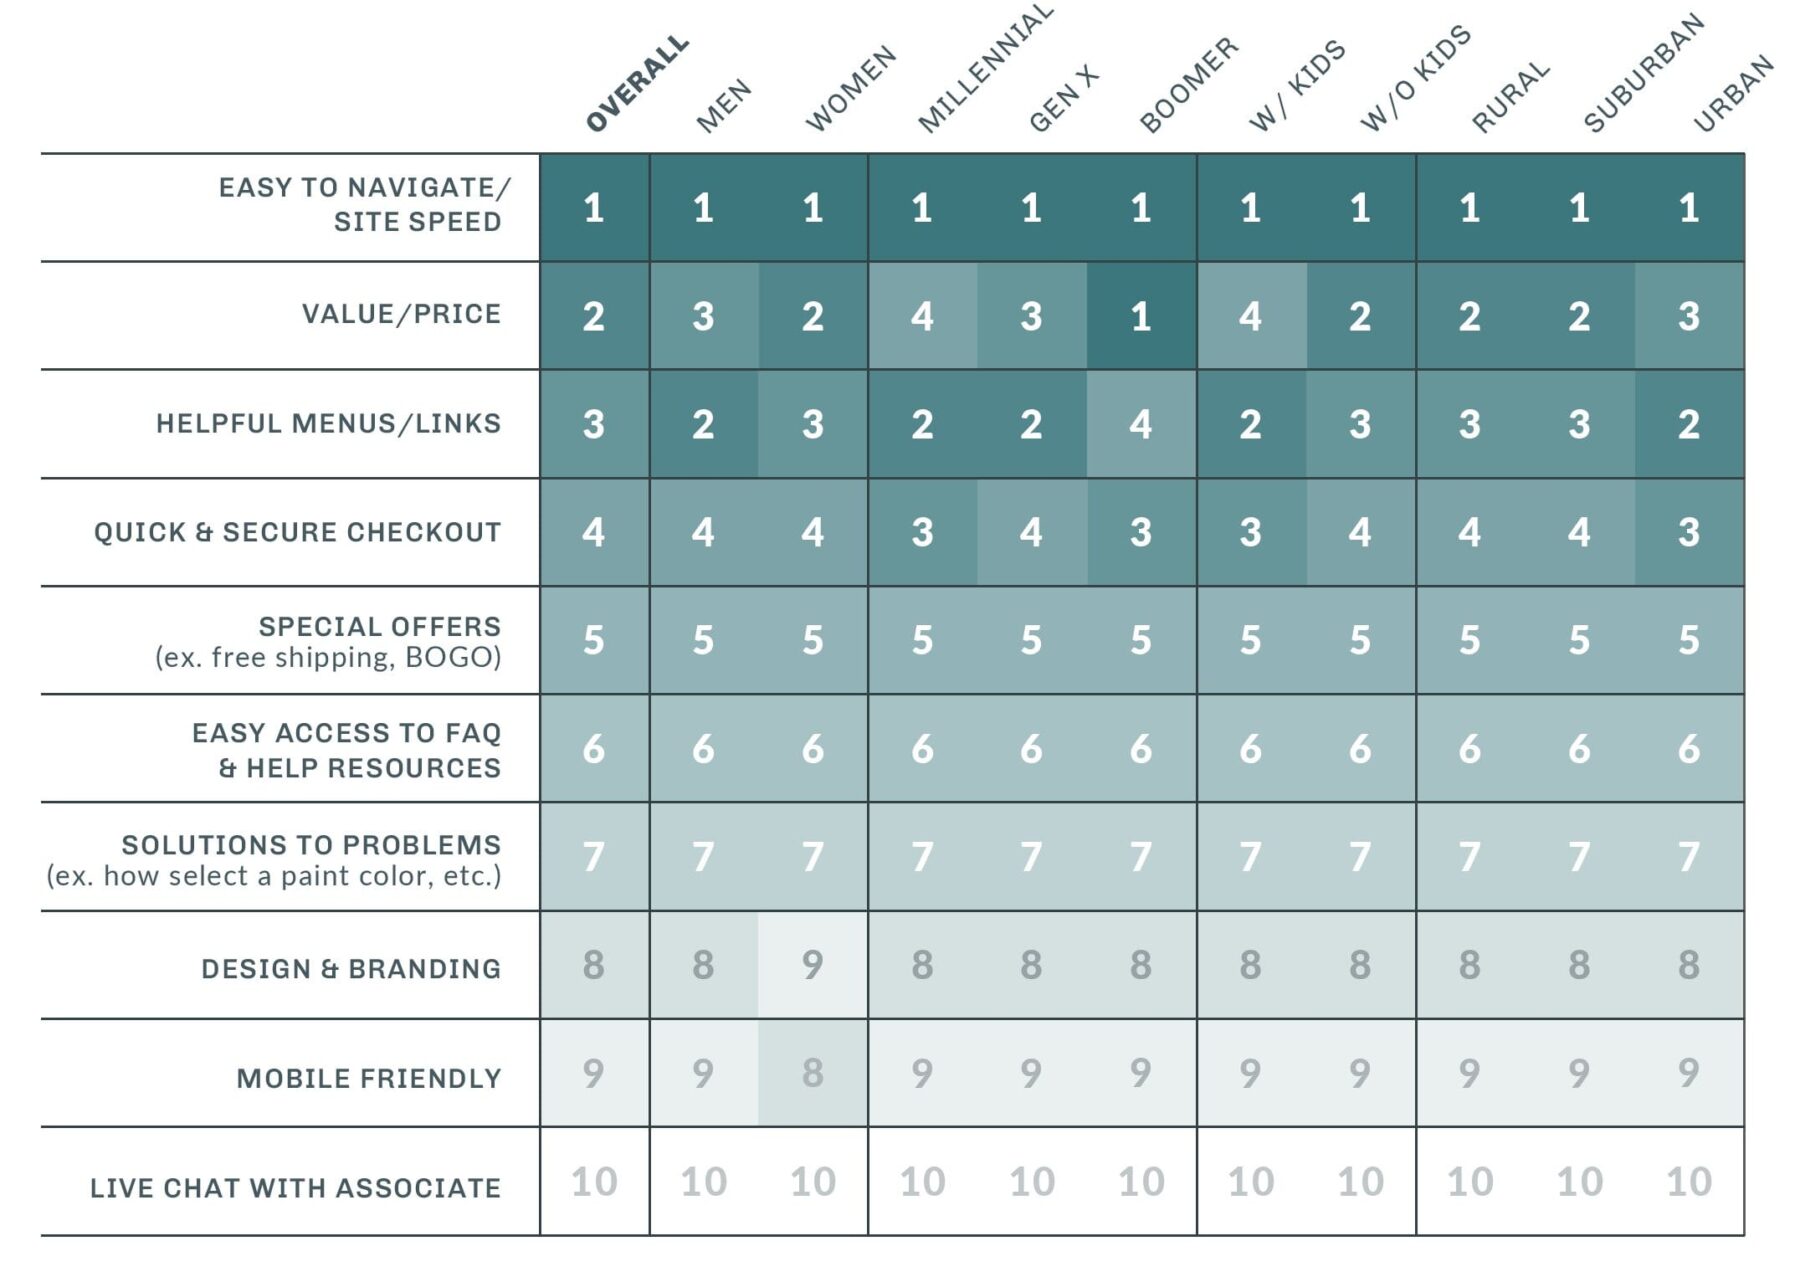
Next, consumers ranked how the following factors influence their in-store shopping:
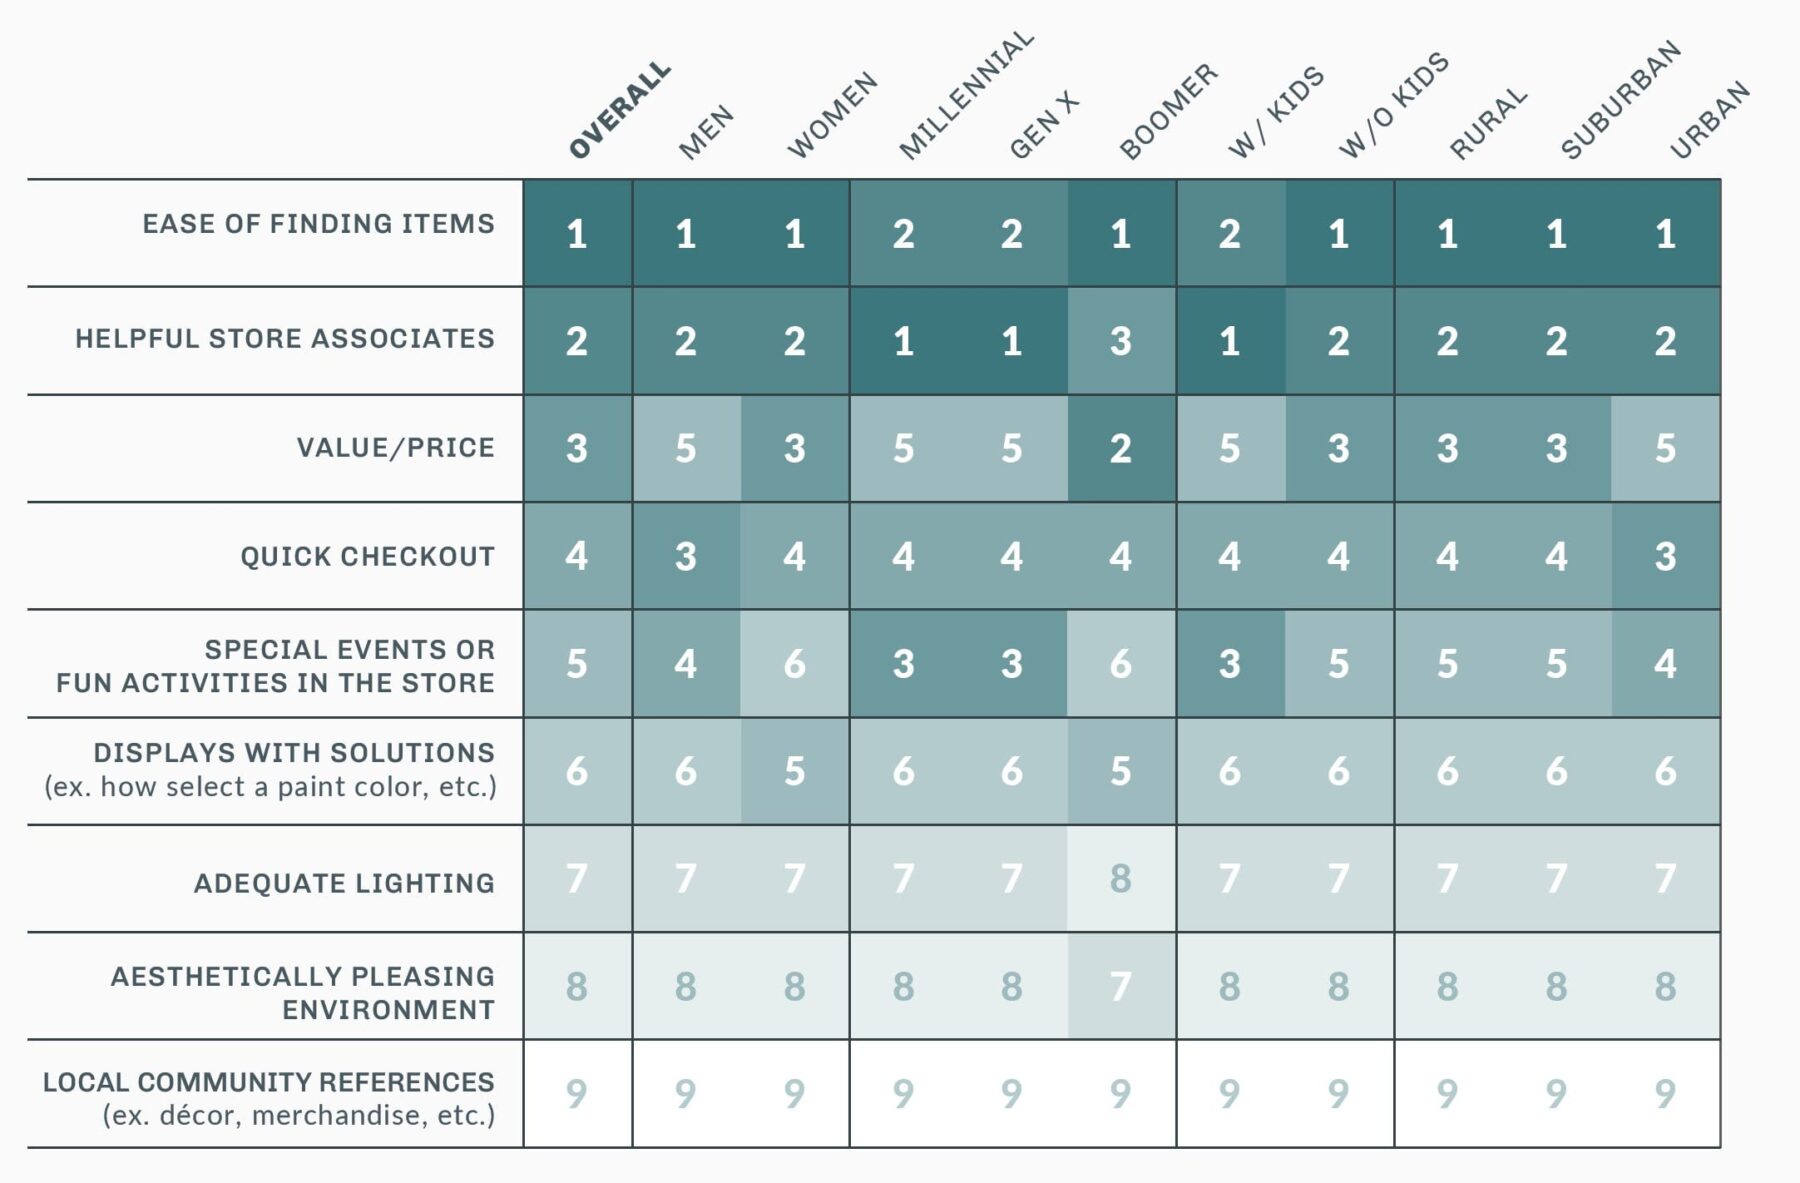
However, there are some changes in ranking order based on demographics. The most notable shift are the swap between the first and second place options for:
Gen Xers
Consumers with kids living at home
Consumers who make between $50k-$150k
While Boomers (and consumers who make between $150k and $200k) keep ease of finding items at number one, they select value/price as the second most important item, nudging helpful store associates down a notch.
2020's Online Impressions
Think of the last time you were shopping ONLINE and felt delighted
or otherwise impressed by the experience.
What website were you on?
By comparing the reasons given between online shopping and in-store shopping, it’s clear that customer service is the distinguishing factor for in-person experiences while selection provides the pull for online shopping.
1) https://techcrunch.com/2020/02/24/target-breaks-into-the- top-10-list-of-u-s-e-commerce-retailers
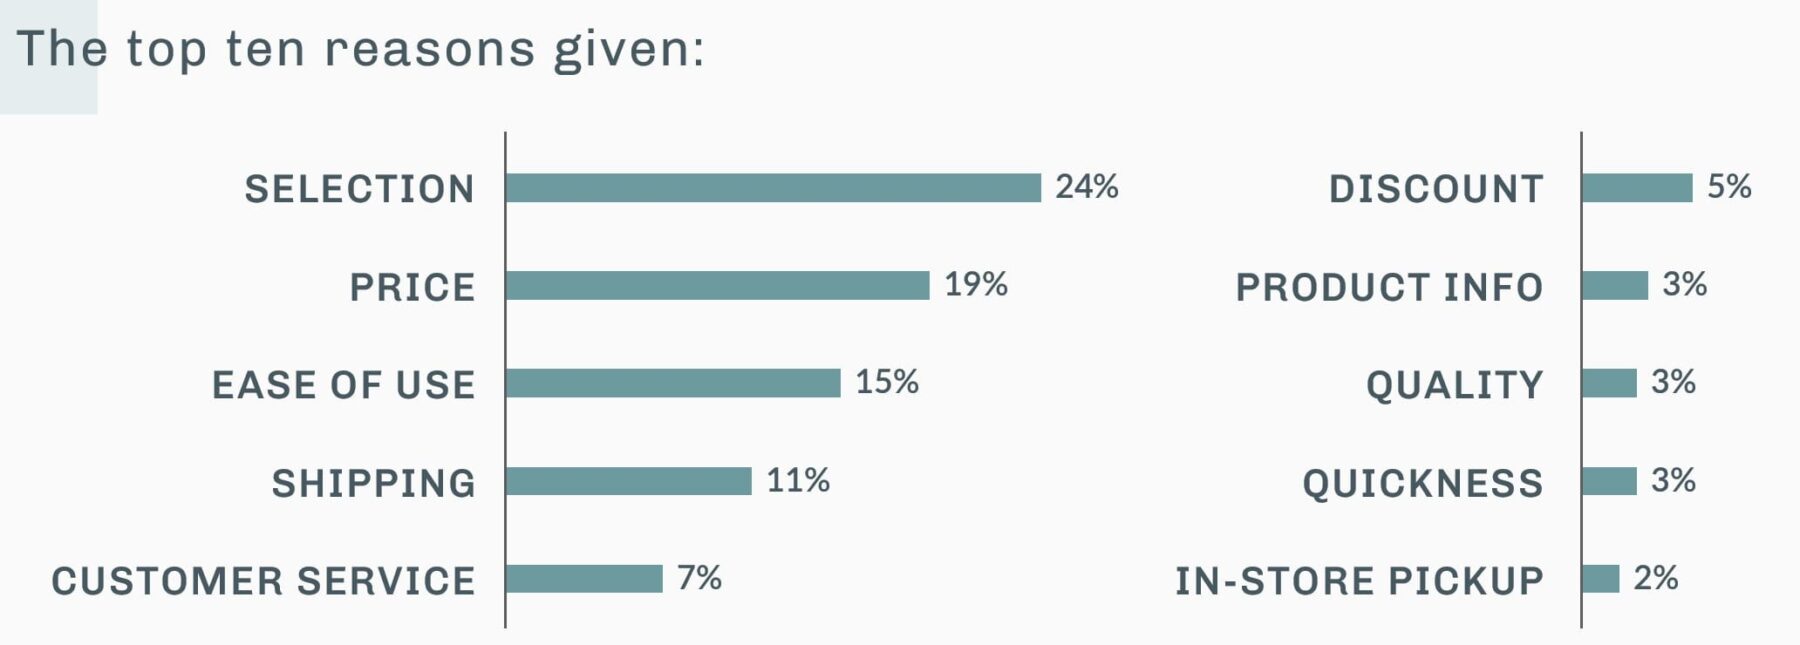
Consumers ranked which factors most influenced their online shopping experience:

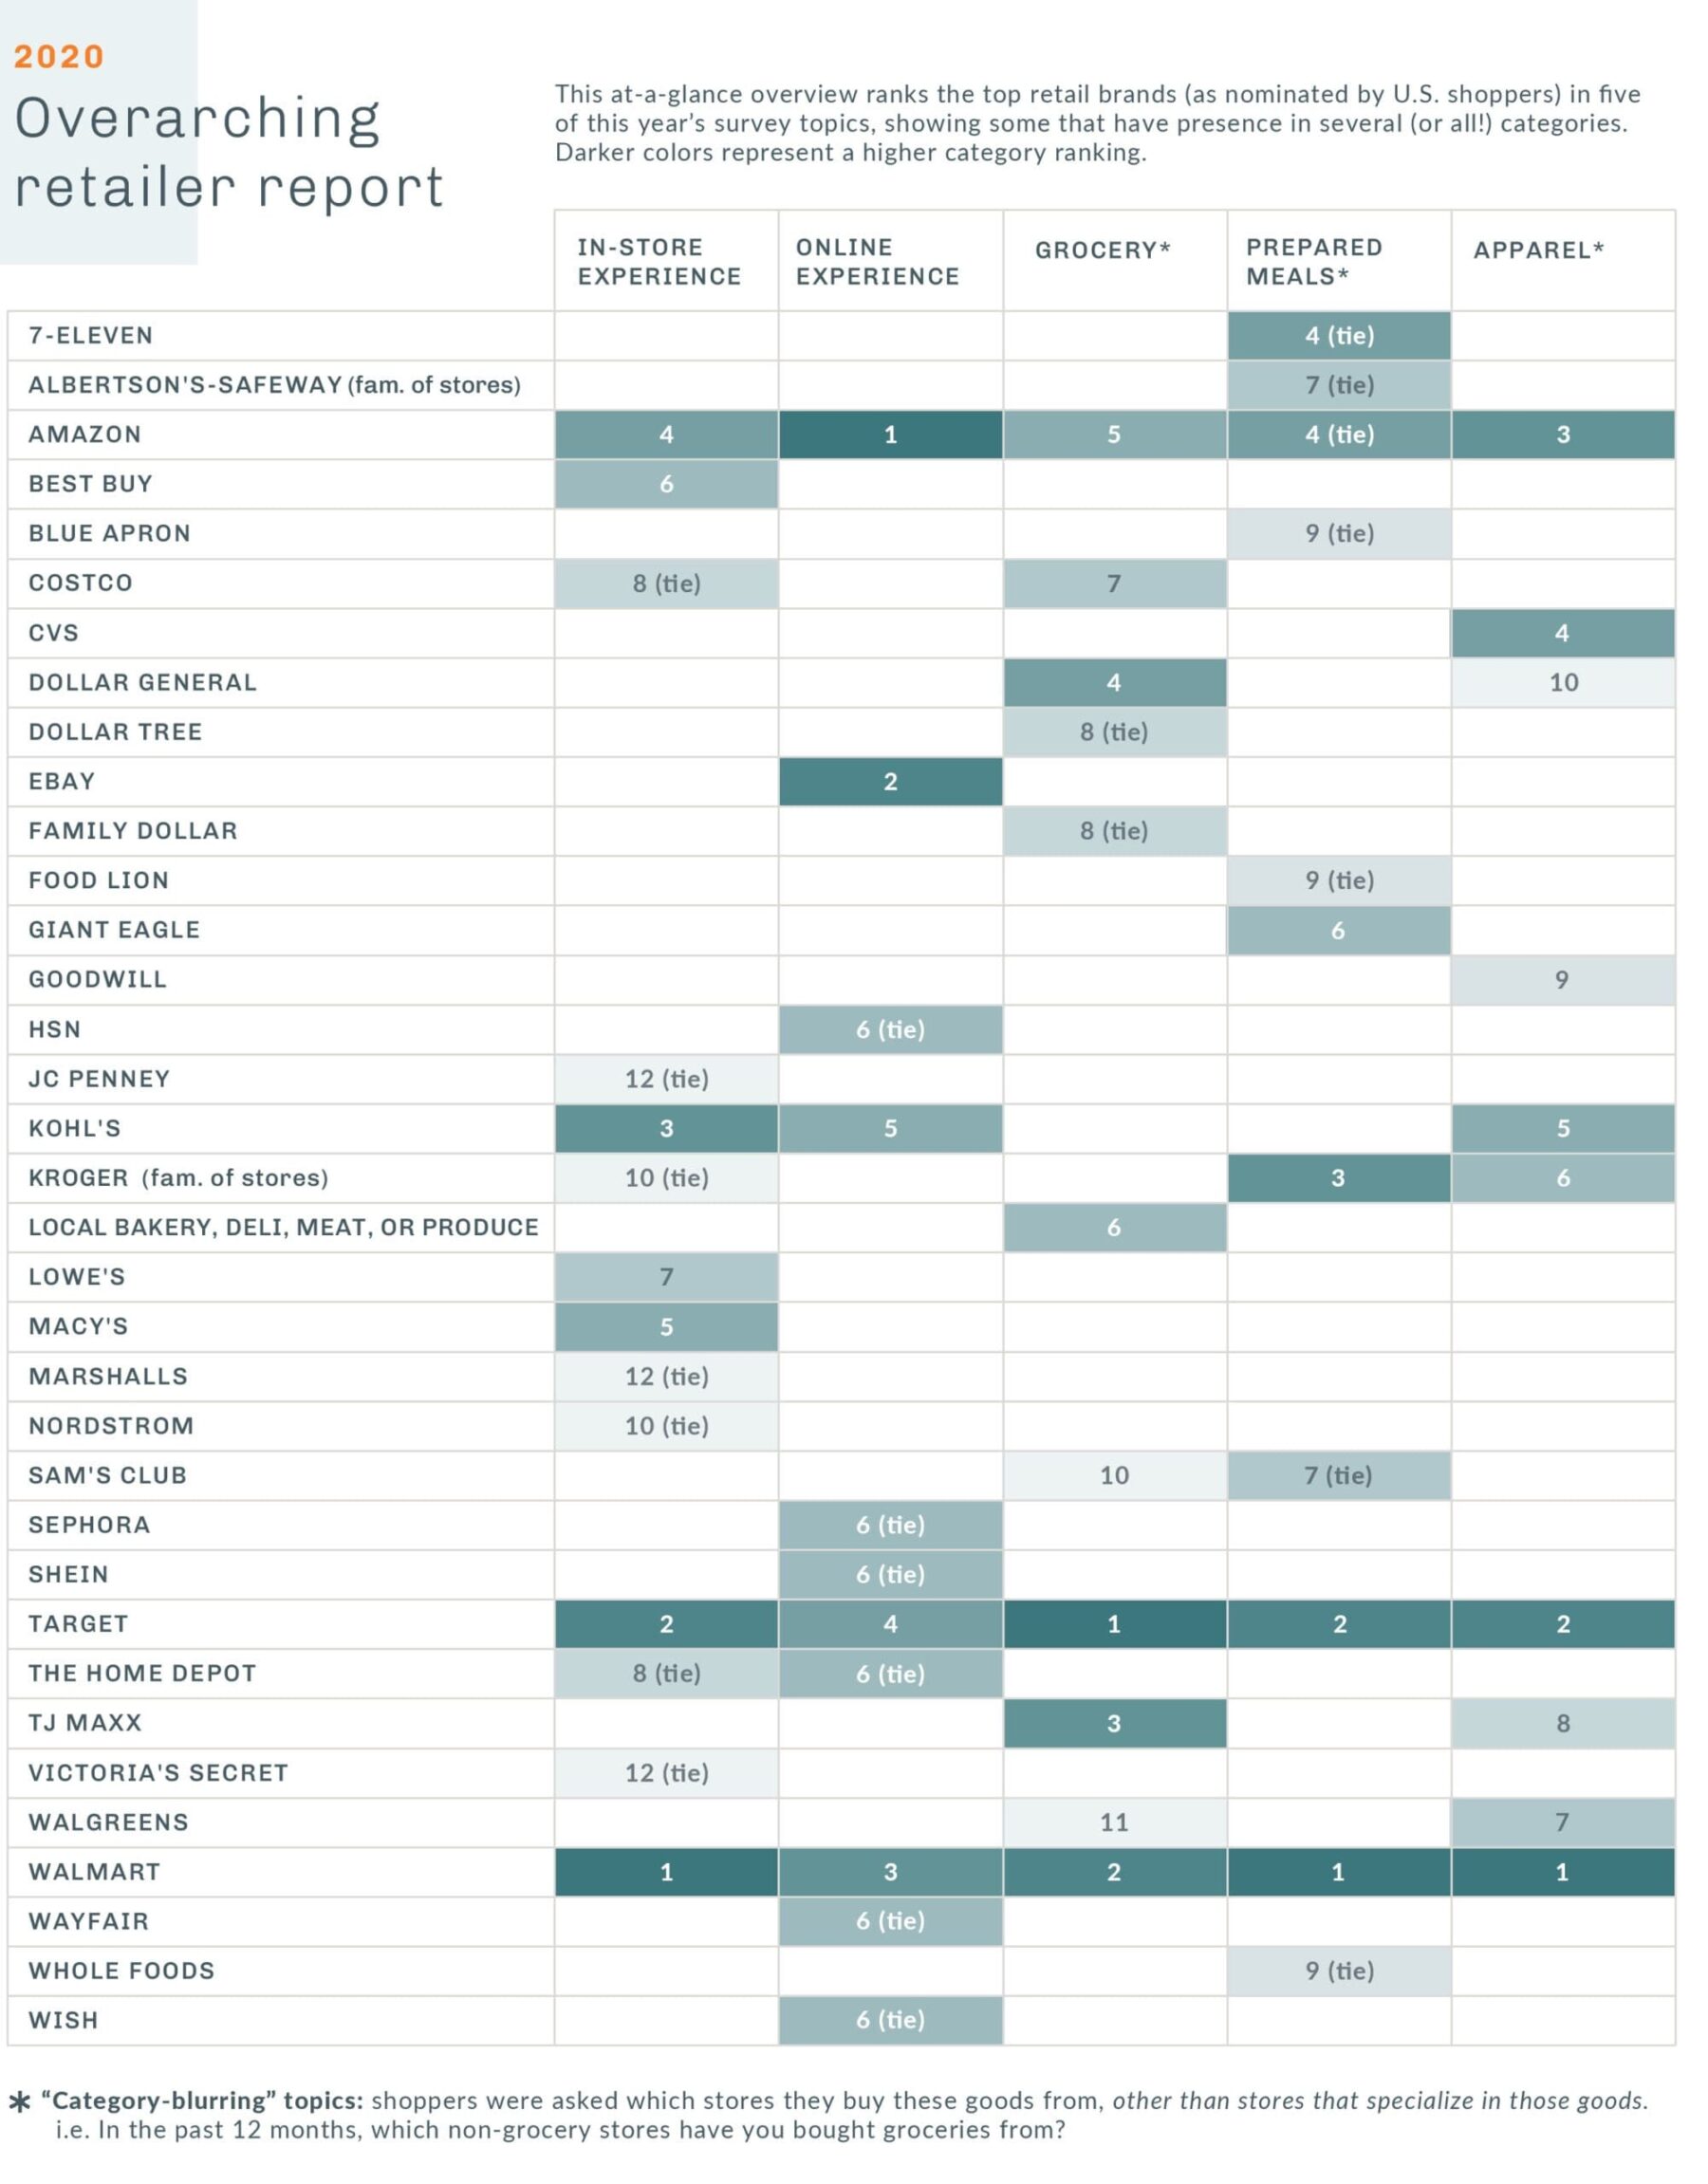
Category Blurring. Where cusromers buy their...
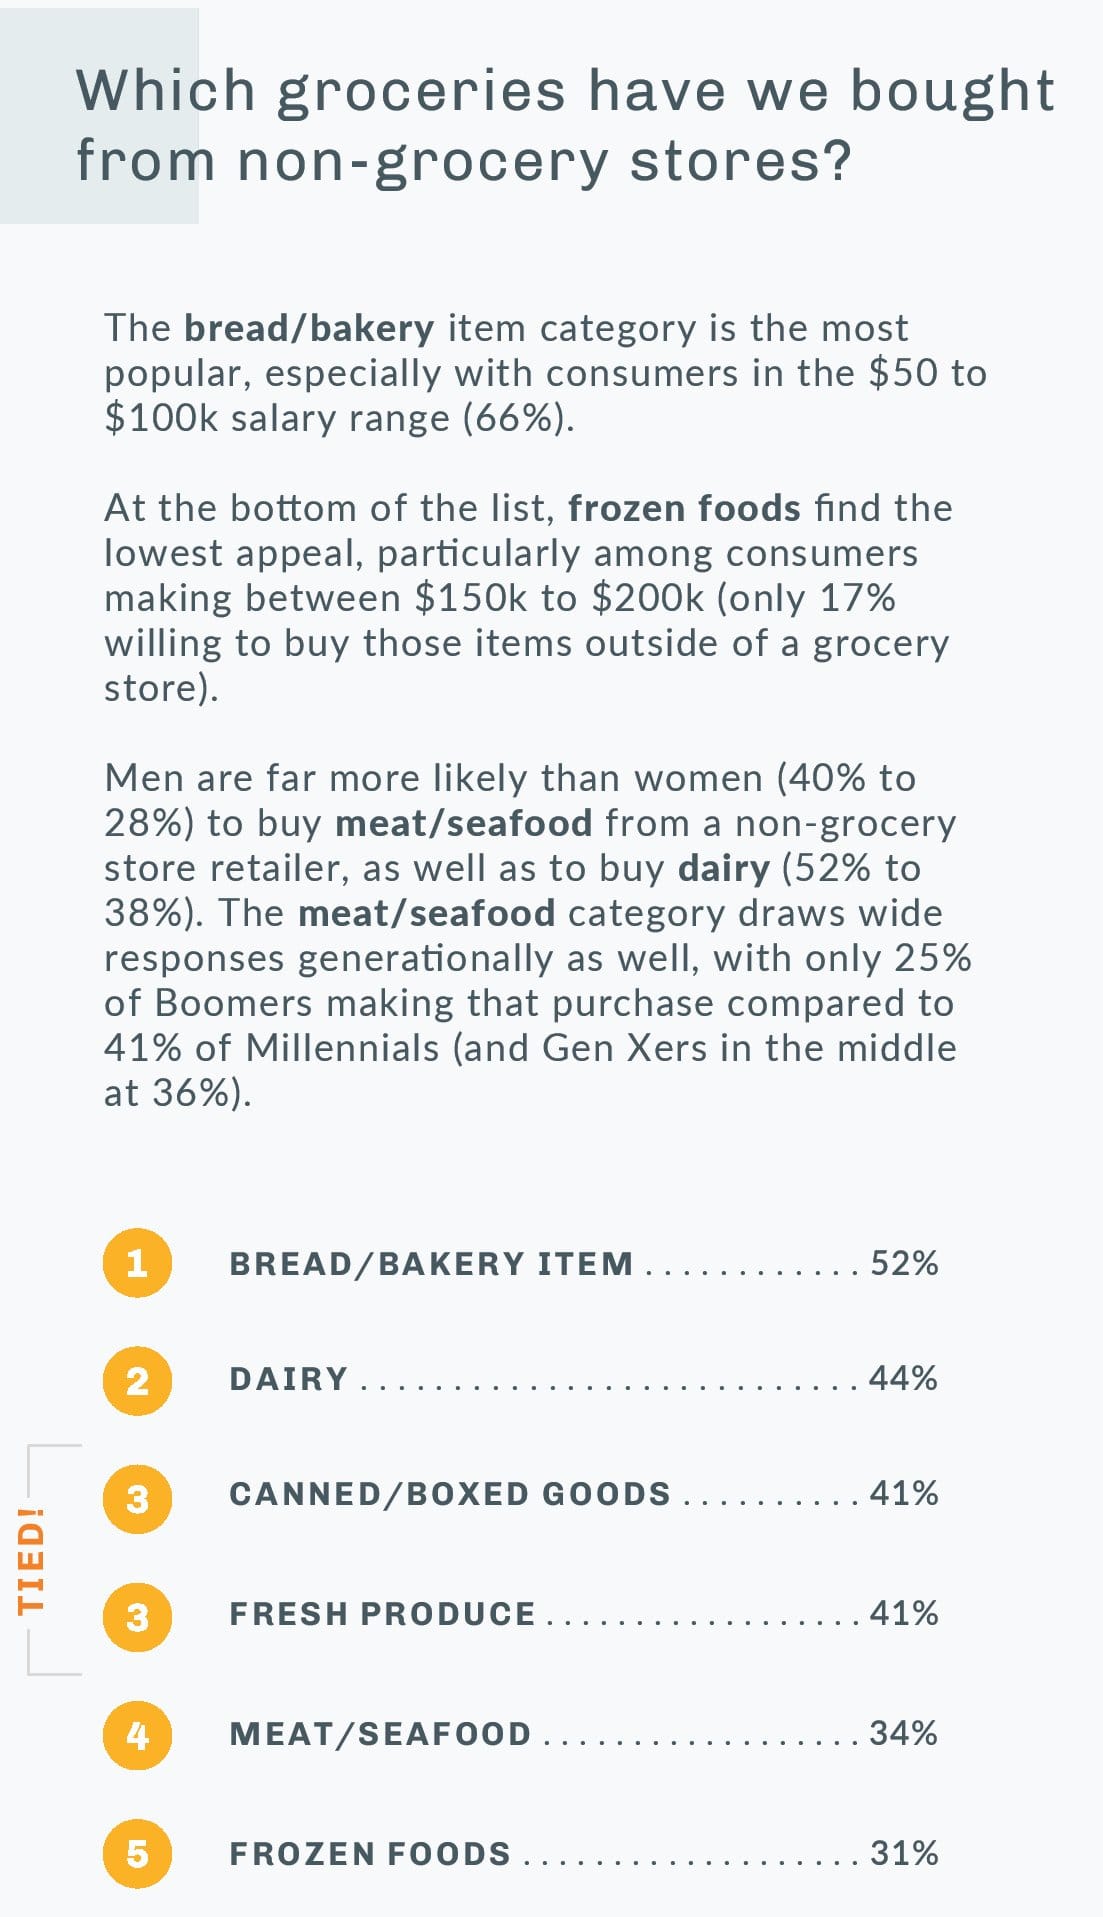
Groceries
The line between conventional grocery stores and other retailers (such as big box stores, discount stores, and department stores) has shifted over the last five years. In 2015, a slight majority (62%) had purchased a grocery item somewhere other than a standard grocery store within the previous 12 months. This year, that percentage jumps up to 83% of consumers.
At the same time, more buyers (42% compared to 28%) have planned to purchase their entire grocery list at a non-grocery retailer, showing a strong upward trend of intentionally shopping elsewhere rather than
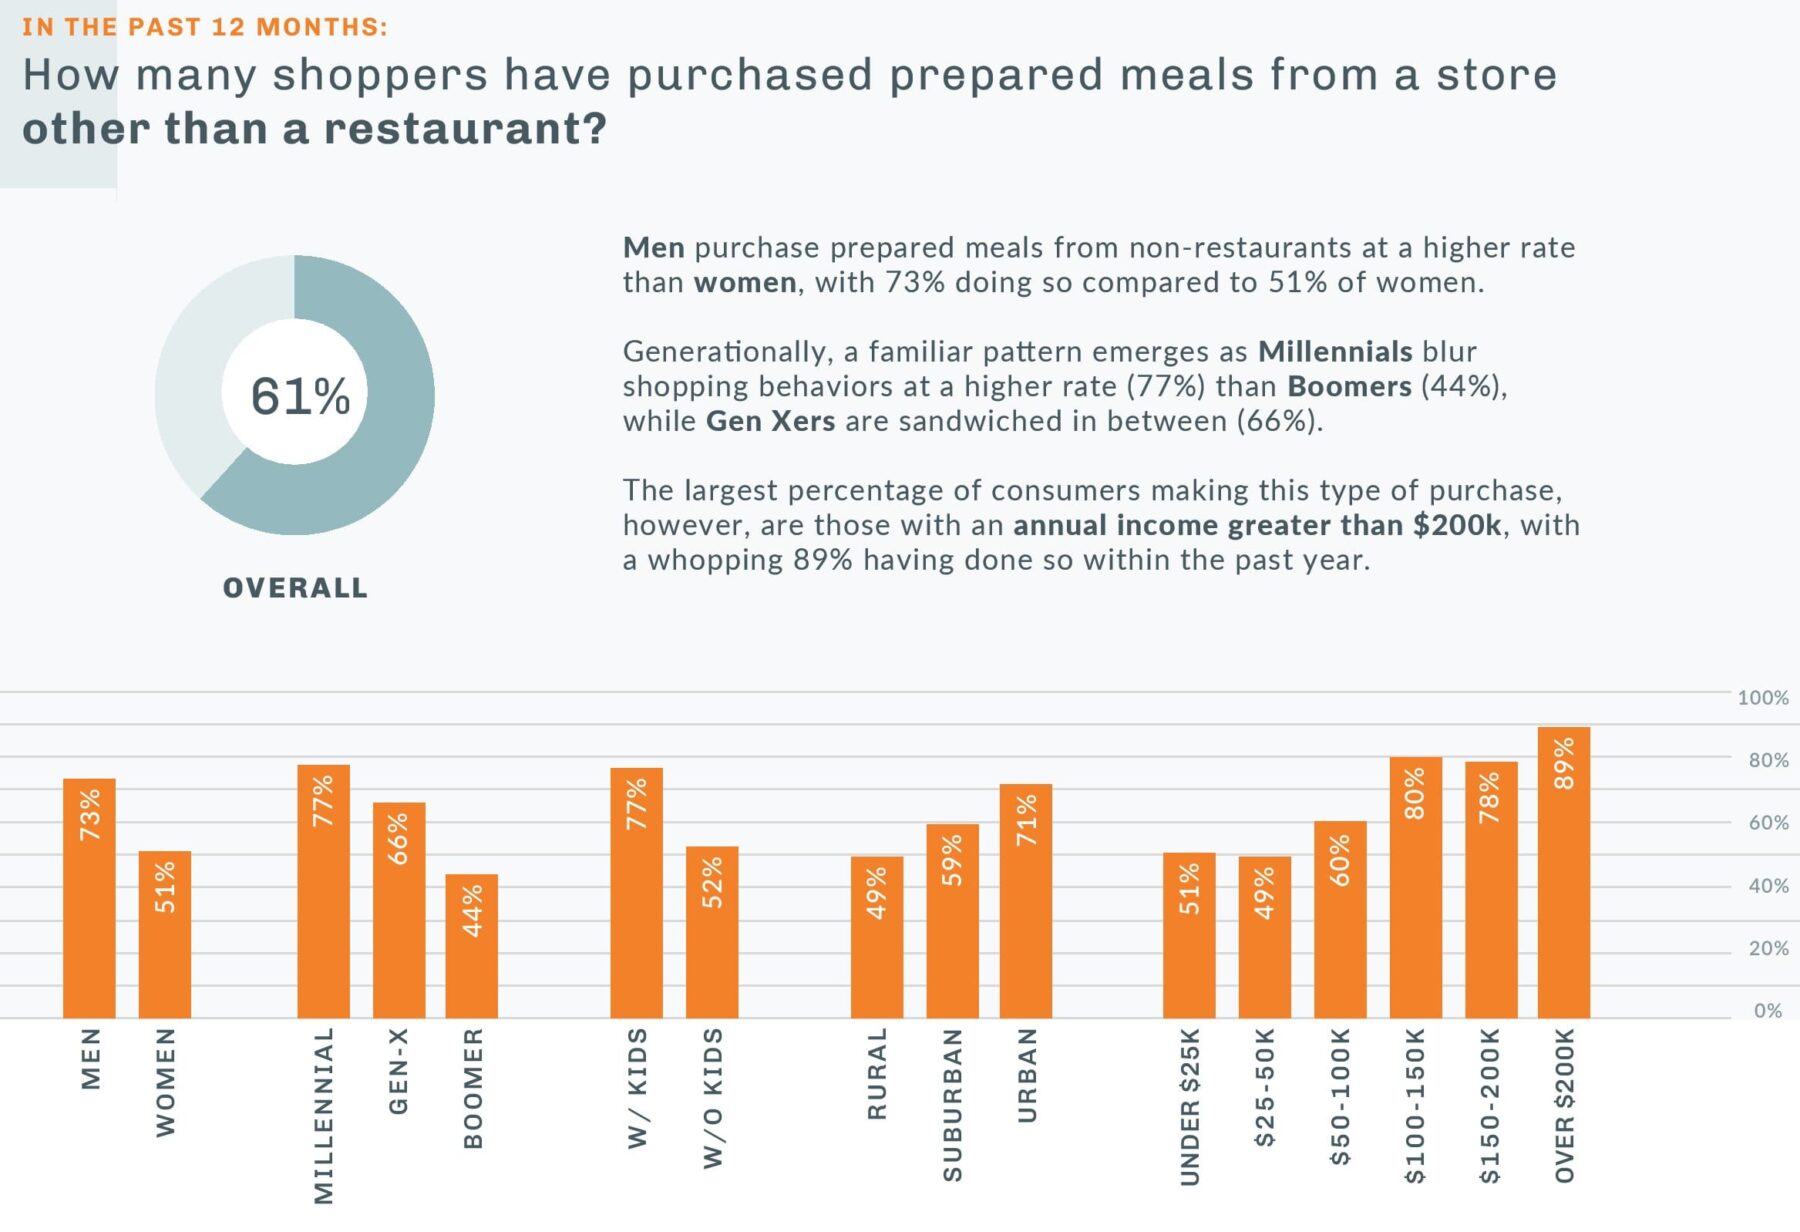
IN THE PAST 12 MONTHS:
Have you made a grocery purchase from a store other than a standard grocery store?
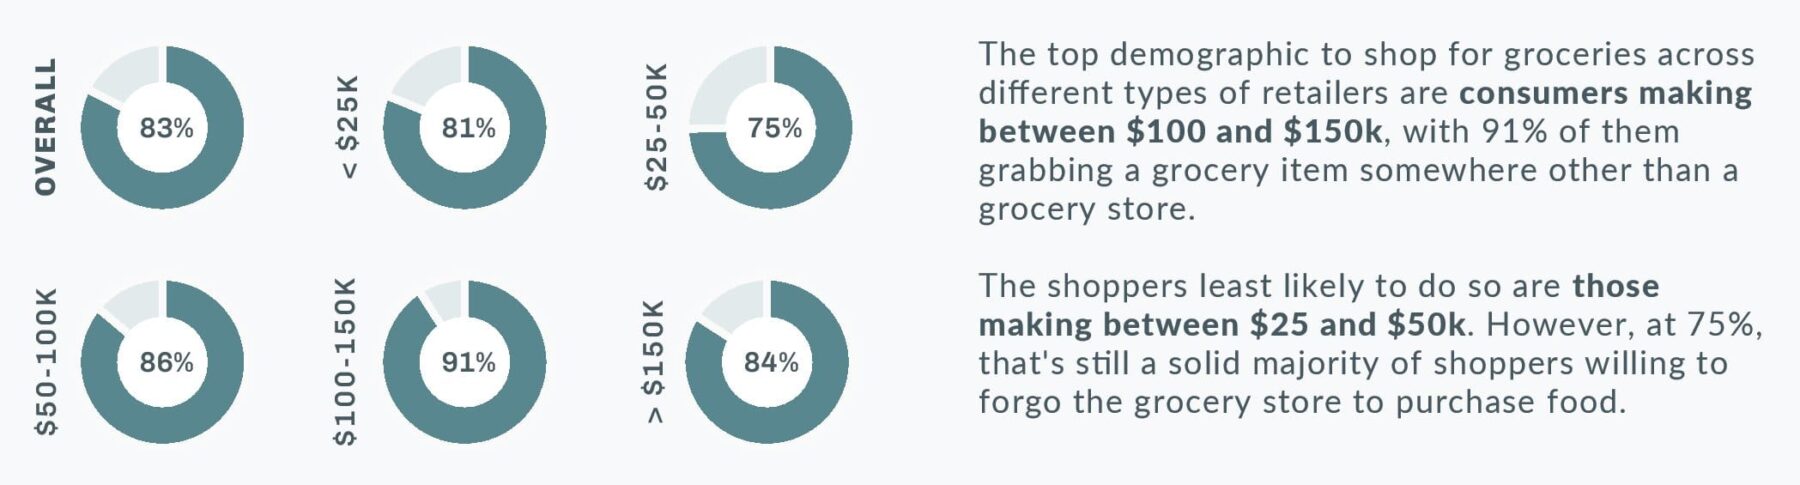
IN THE PAST 12 MONTHS:
How many shoppers have made a grocery list intending to fulfill ALL purchases at a non-grocery retailer?
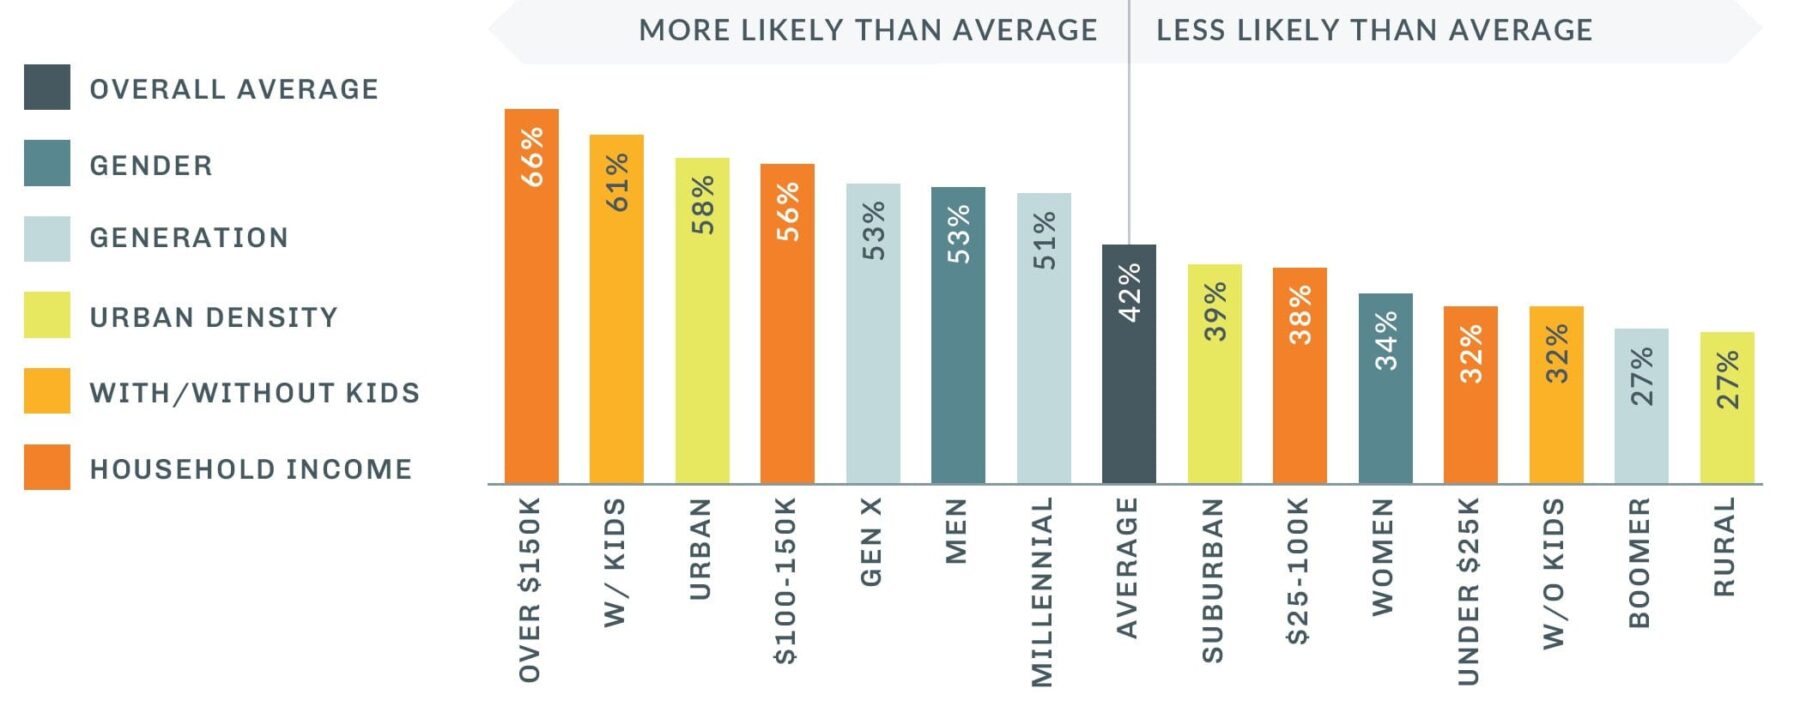
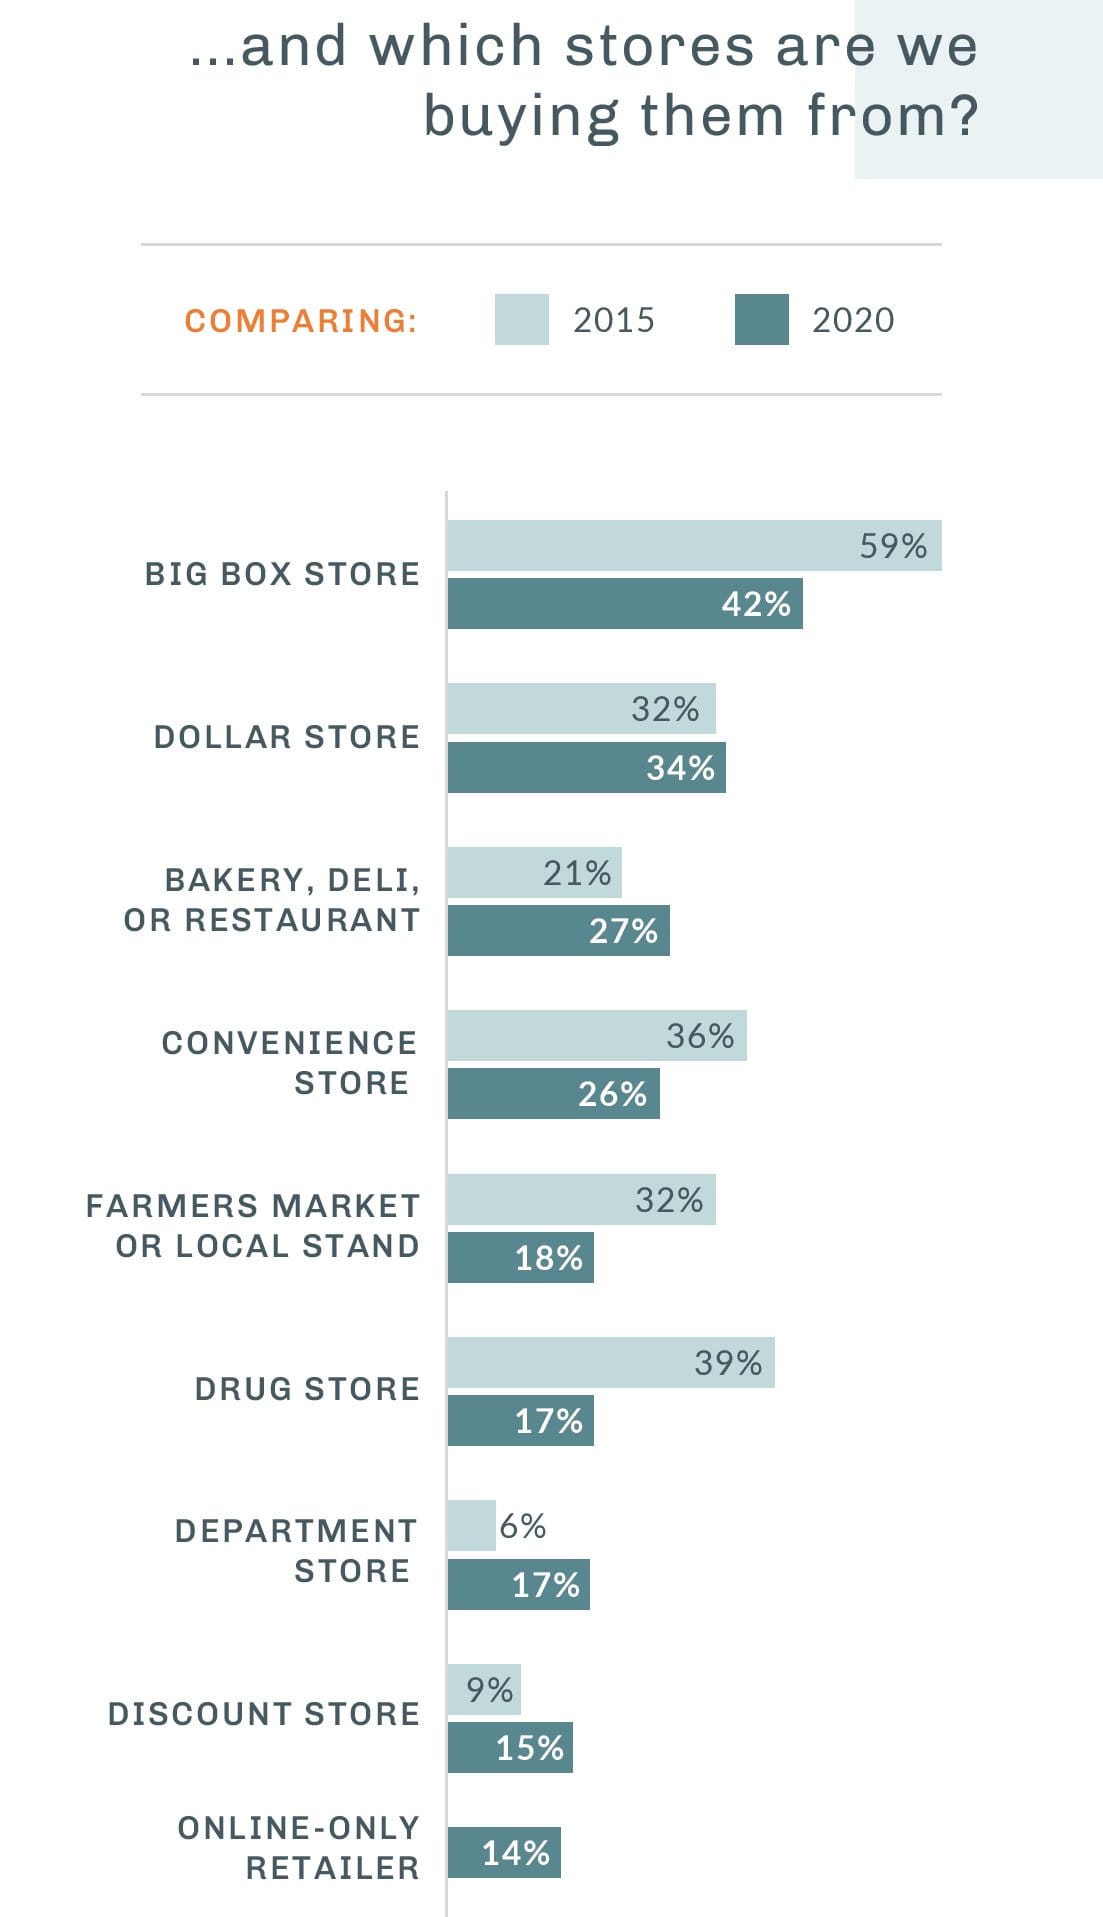
New to 2020, we added online-only retailers (such as Amazon) as one of the non-grocery store options. It debuts in last place (14%) but only slightly behind discount stores (15%).
For Gen Xers, however, the new category comes in at the sixth spot with 23% shopping online for groceries (compared to only 11% each for Millennials and Boomers).
The top three categories stay relatively consistent regardless of demographics. The main exceptions are urban consumers and people making under $25k a year both slightly preferring dollar stores over big box stores.

Category Blurring. Where customers buy their...
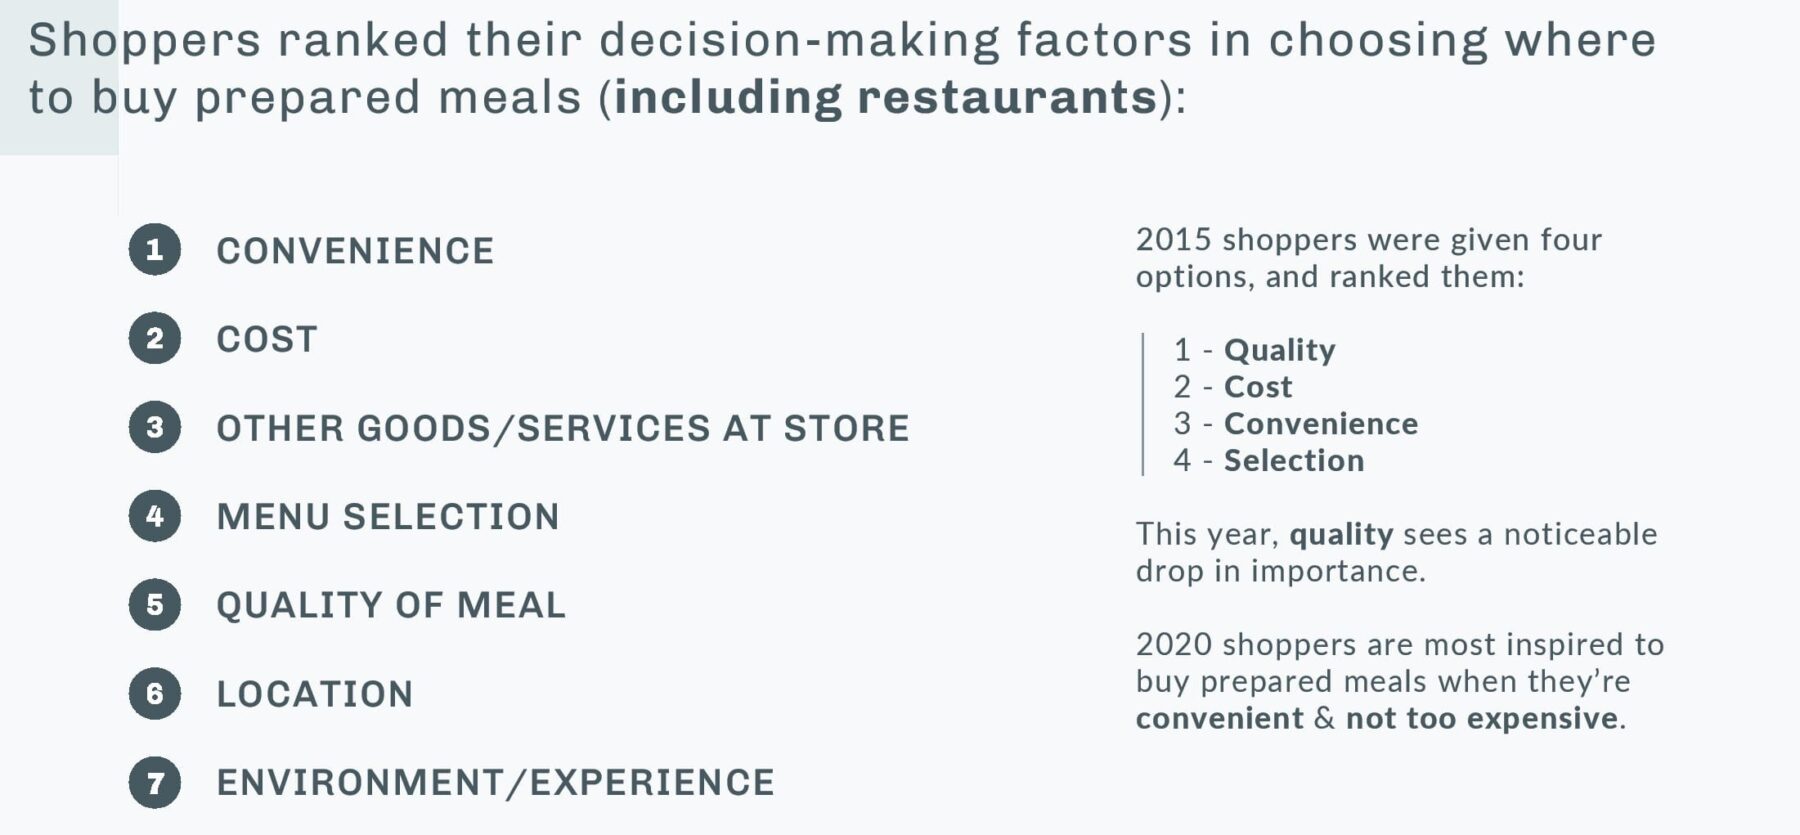
Prepared Meals
While the selection of retailers offering ready-to-eat meals has expanded, the percentage of consumers who have purchased a prepared meal from a non-restaurant option has held steady, coming in at 61% again this year.
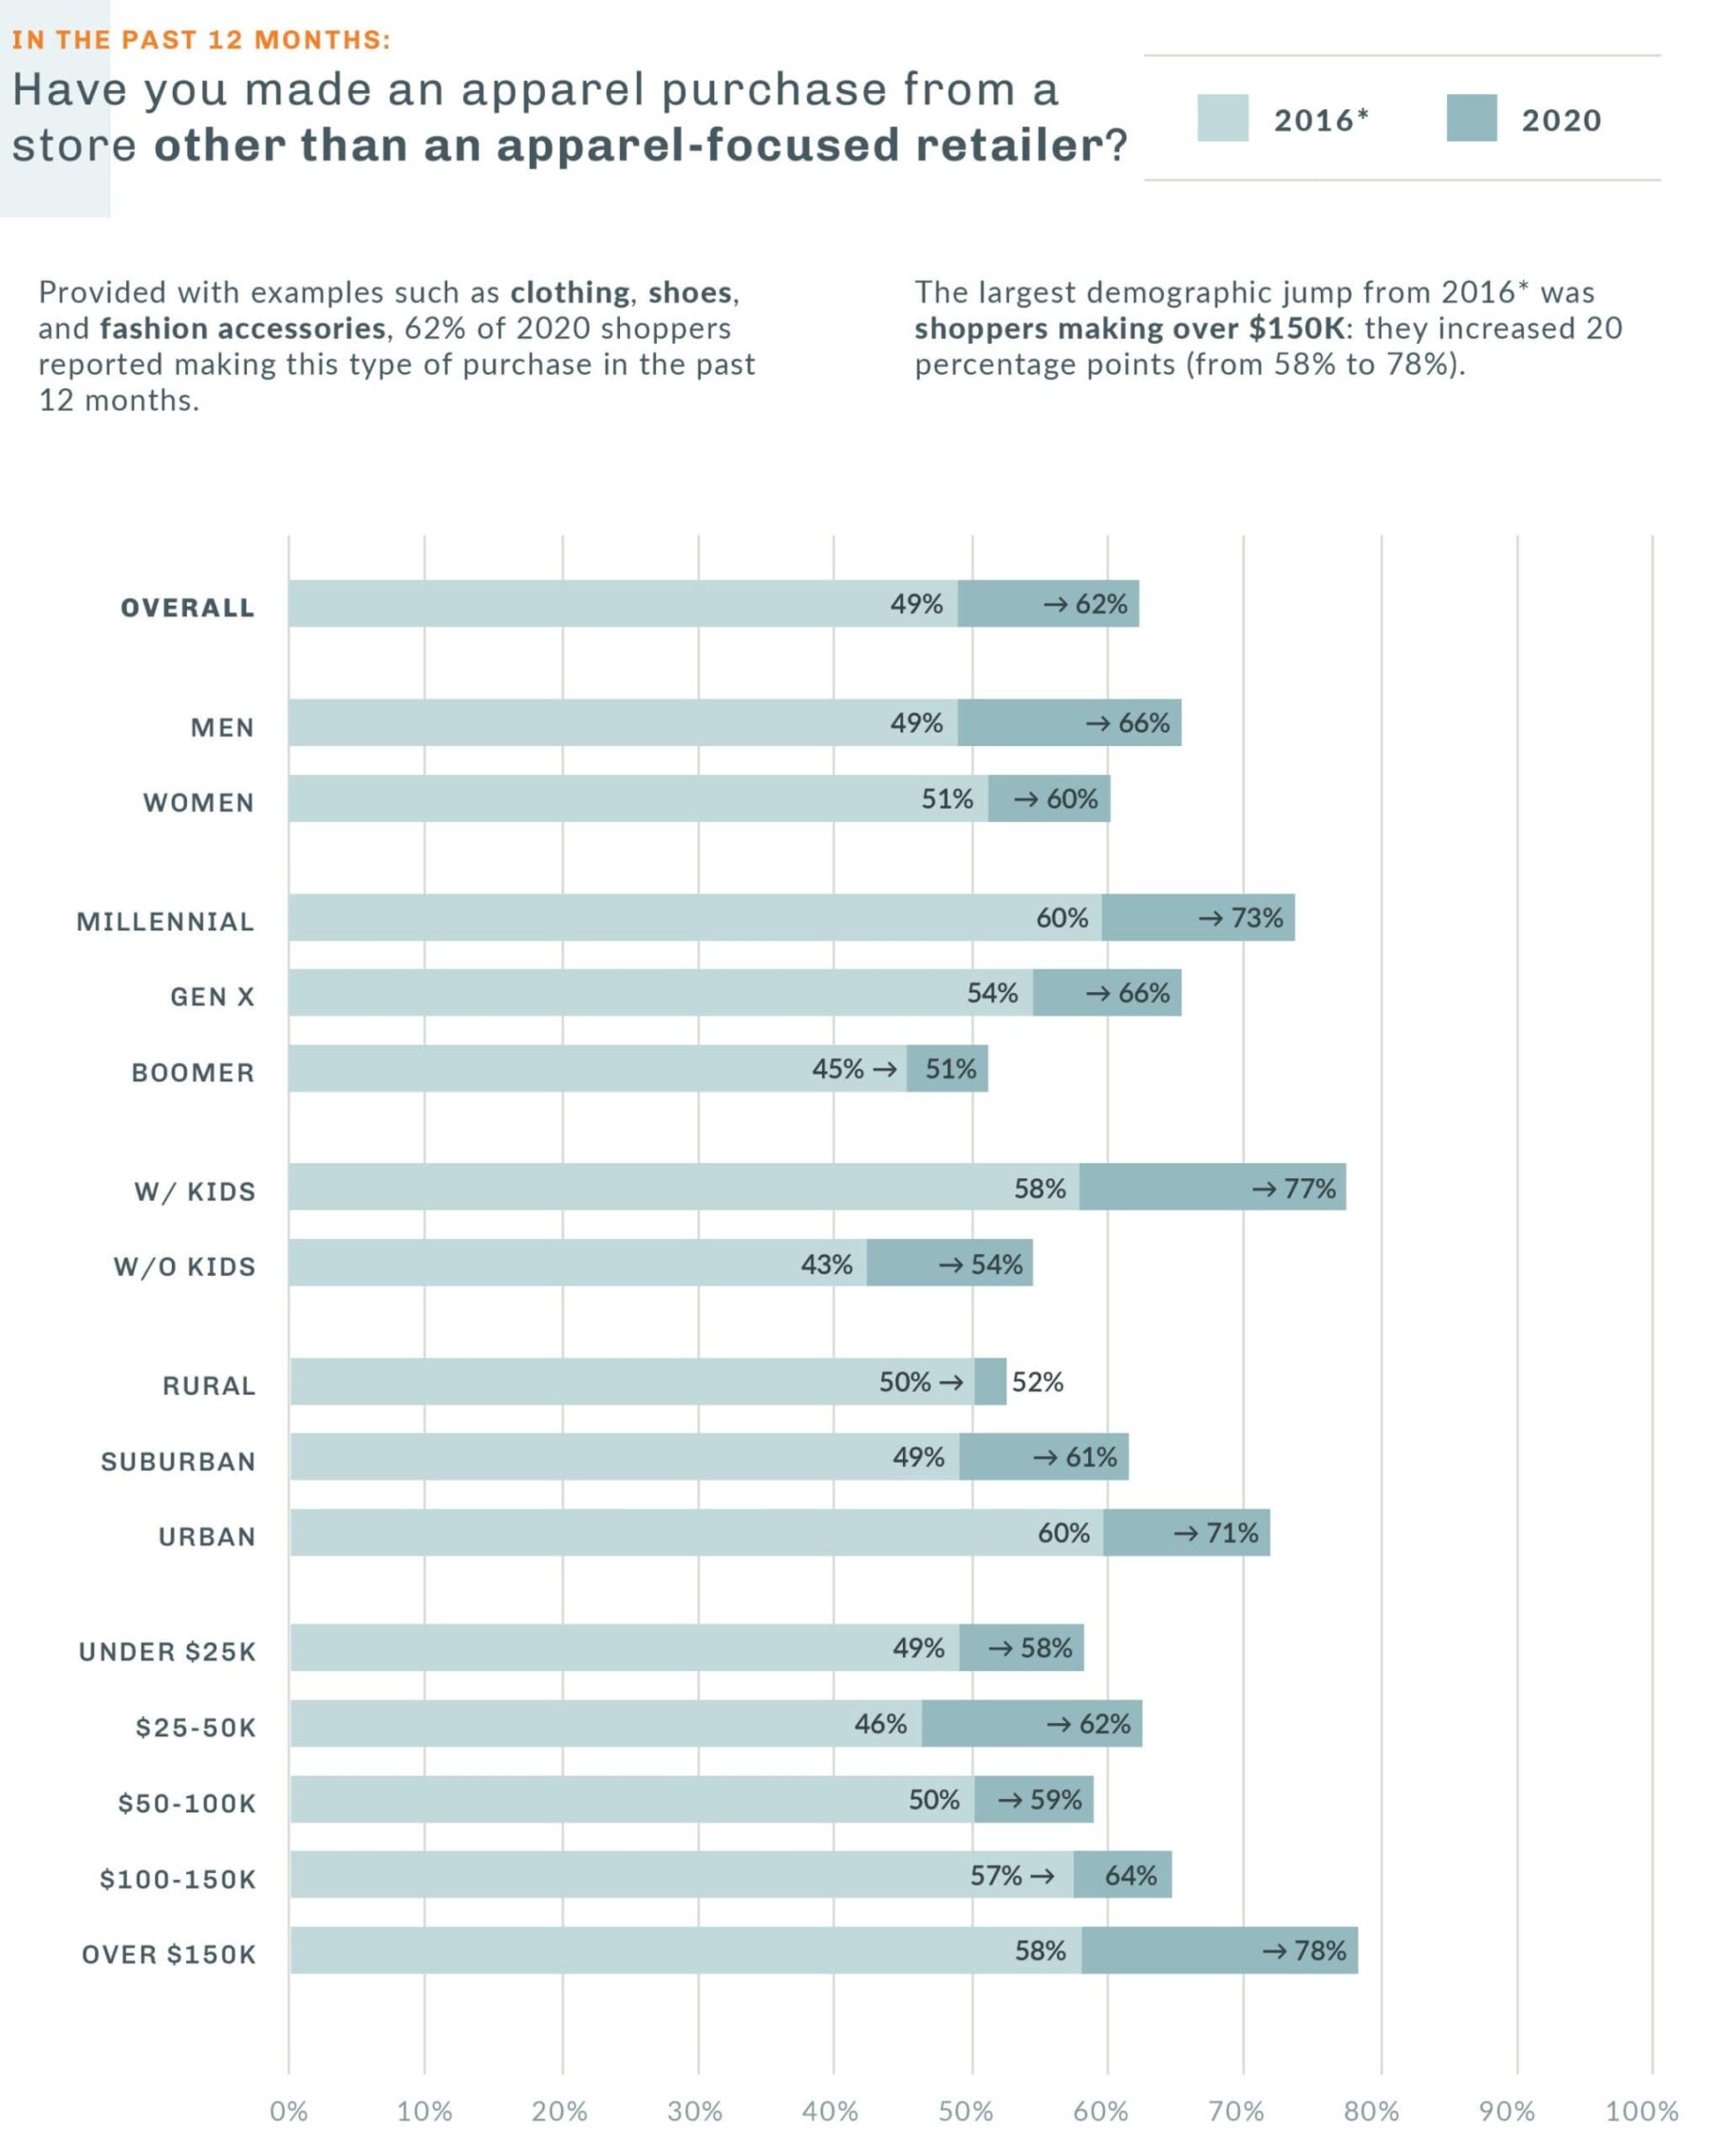
Category Blurring. Where customers buy their...
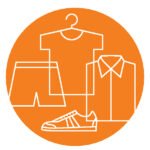
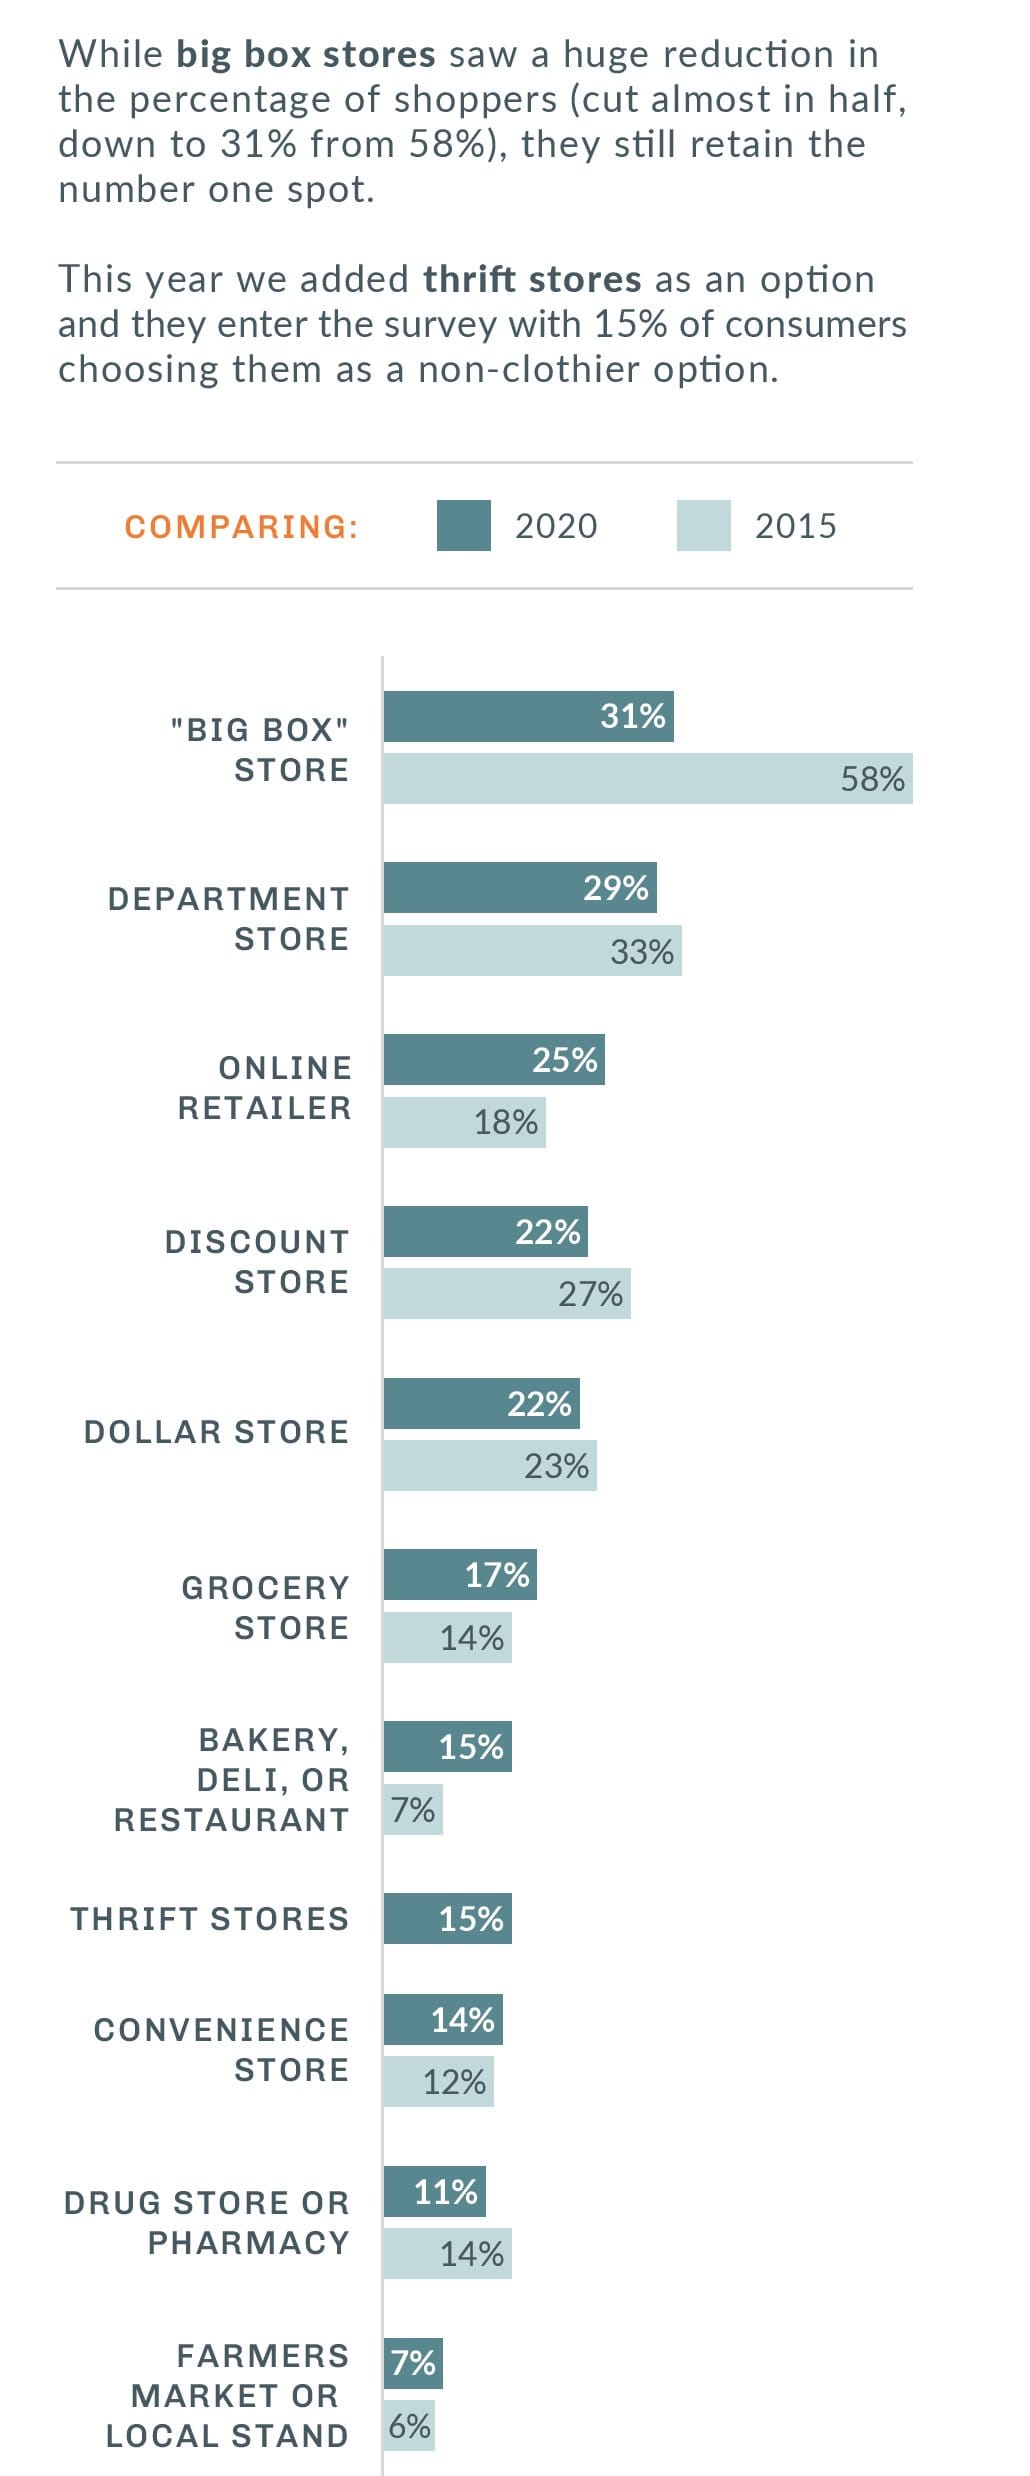
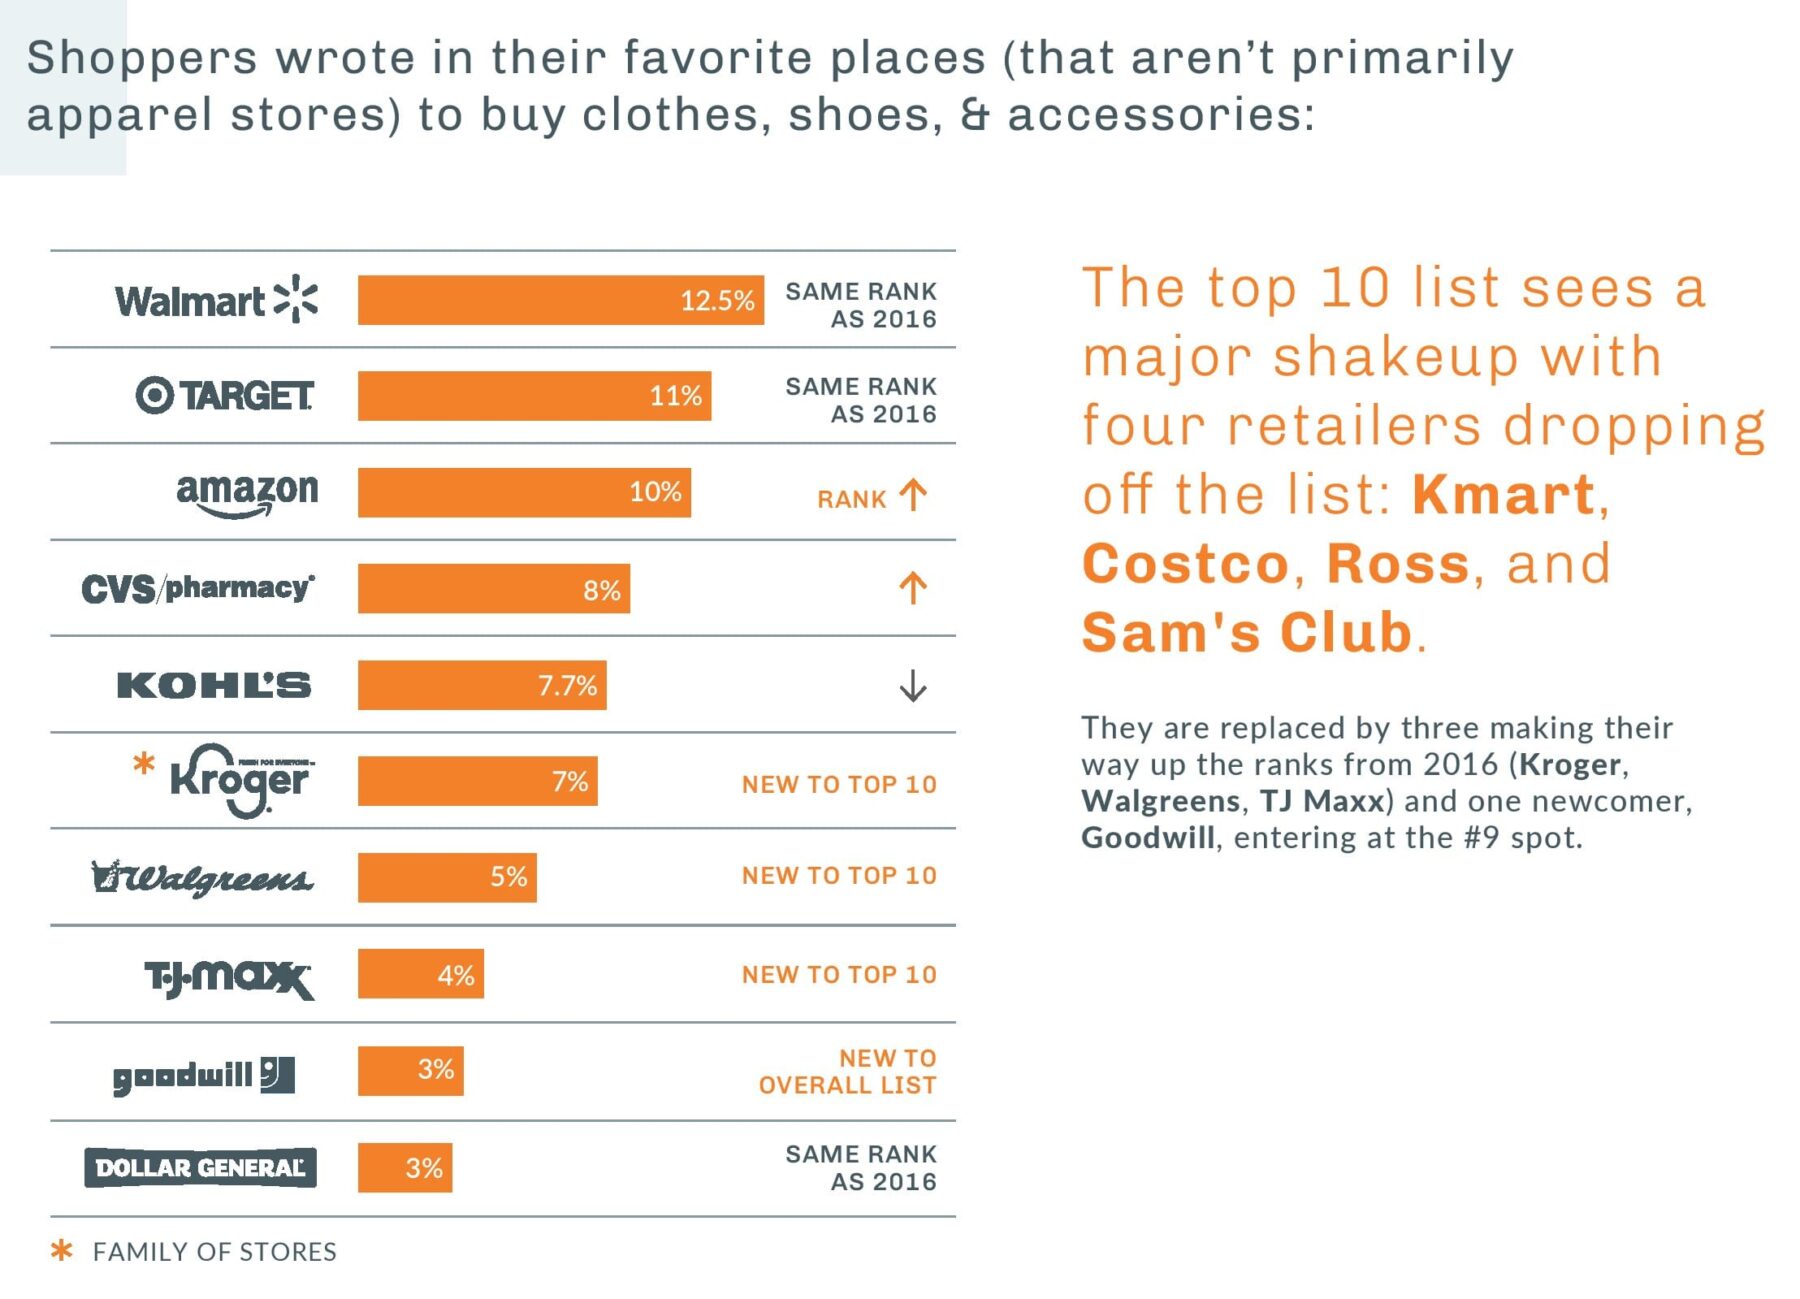
Apparel
We first added questions about apparel in our 2016 survey, so 2020’s comparisons go back four years instead of five. In 2016, slightly under half of consumers (49%) had made an apparel purchase from a store other than an apparel-specific retailer.
This year, 62% of consumers have made such a purchase at least once over the past 12 months. In fact, at least 50% from each demographic reported doing so, with the lowest being Boomers at 51%. The largest majority was consumers with incomes over $200k, at 83%.
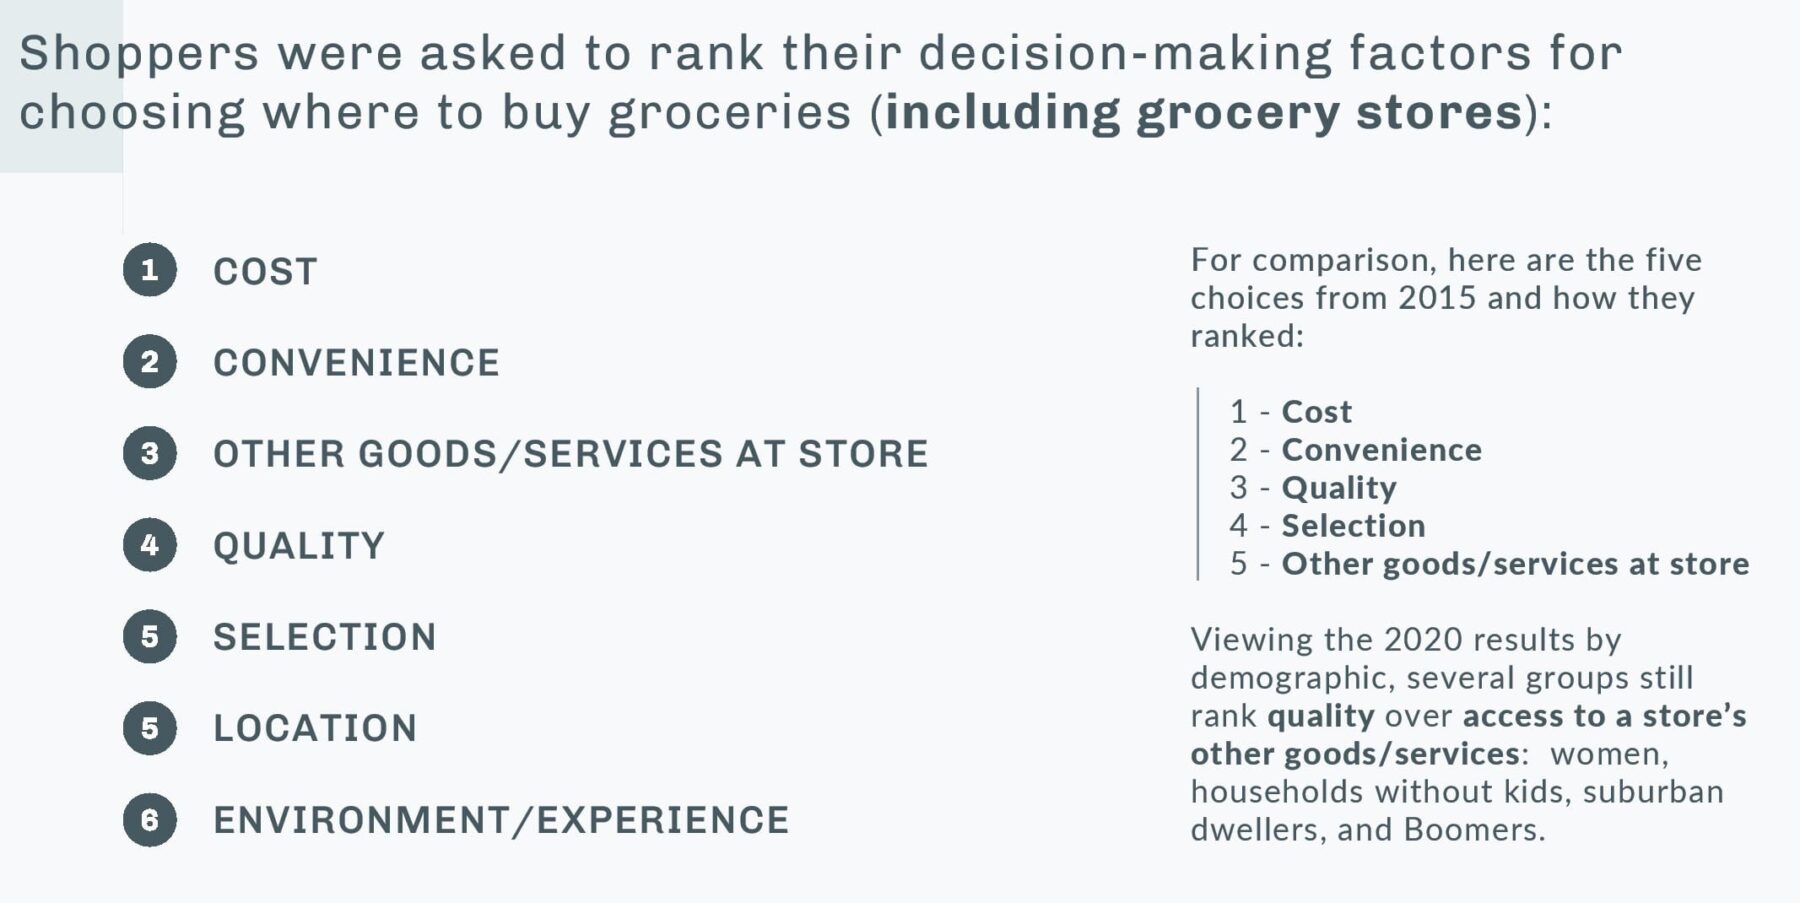
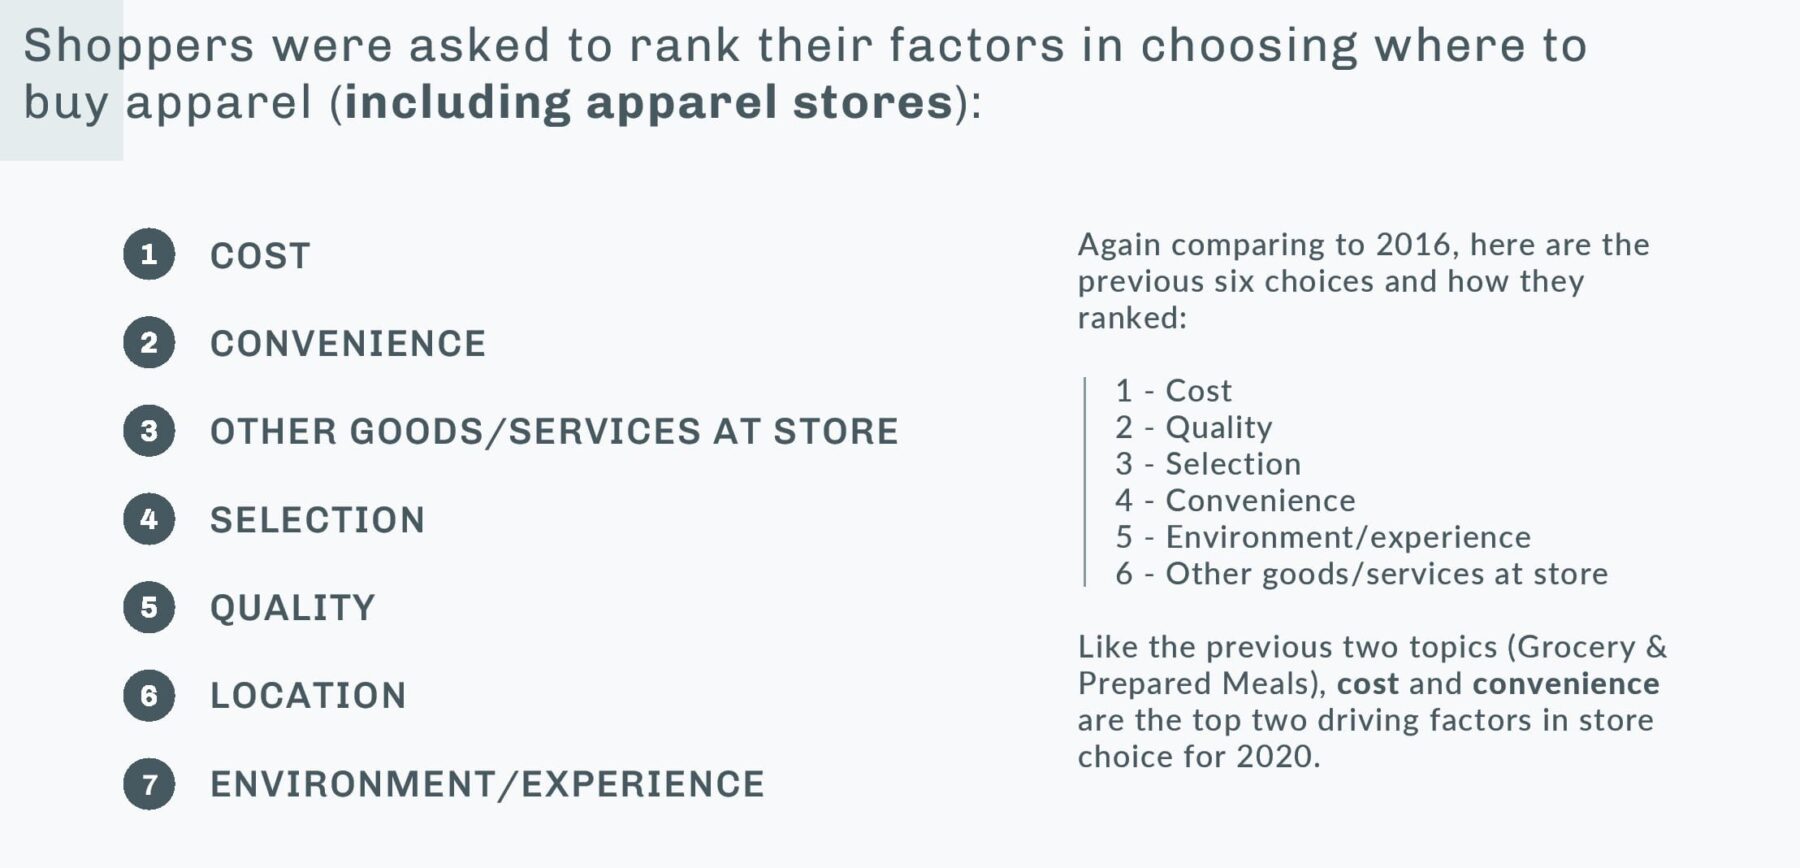
What influenced shoppers’ choice of clothing store? Convenience
leapt up from the #4 spot to share the limelight with cost at the top of the list.
Zooming out, 2020 shoppers ranked influence factors similarly across all three category-blurring topics: Grocery, Prepared Meals, and Apparel. Notably, cost & convenience sat at the top of all three lists.
This year we added location as an influence factor for all three topics. Shoppers ranked it at the bottom of their list across the board, along with environment/ experience.
Summary
For the 5th year, King Retail Solutions (KRS) studied U.S. consumer behaviors across demographics, preferences, shopping trends, and cross-channel habits. The 2020 survey highlights mobile-first online shopping, subscription growth, in-store pickup trends, category blurring, and key factors influencing both online and in-store shopping experiences.
Key Takeaways
- Mobile devices have overtaken desktops for online purchases, with Millennials leading in app-centric shopping.
- Online and in-store shopping are increasingly intertwined, with 77% of consumers using both options with the same retailer.
- BOPIS (Buy Online, Pick Up In Store) surged from 40% in 2015 to 76% in 2020, with demographics varying by age and income.
- Subscription services doubled in adoption over five years, now used by 53% of consumers, with 89% adoption among high-income shoppers.
- In-store delight is driven primarily by helpful customer service and selection, while online delight is driven by easy navigation and product selection.
- Category blurring is growing, with more consumers buying groceries, prepared meals, and apparel outside traditional stores due to cost and convenience.
Frequently Asked Questions
Q. Has COVID-19 led consumers to cut back on in-store shopping?
A. Even during the pandemic, 7 in 10 people still shop in-store for essentials. PPE solutions like sneeze guards and hand sanitizers help maintain safe shopping experiences.
Q. What motivates shoppers to visit a store instead of shopping online?
A. Shoppers seek better selection, instant gratification, and avoid delivery fees. Stores provide solutions to common online frustrations.
Q. Which devices and apps are consumers using for online shopping?
A. Most consumers use mobile phones as their primary device for online purchases. 83% have at least one shopping-related app installed, with Millennials leading at 93%.
Q. How has BOPIS grown in recent years?
A. BOPIS usage rose from 40% in 2015 to 76% in 2020, with high-income consumers and Millennials showing the highest adoption. Electronics purchases via BOPIS declined while food pickup increased.
Q. What factors influence in-store vs. online delight?
A. In-store delight is mainly driven by helpful staff and product selection. Online delight is influenced by site navigation, speed, and product availability.
